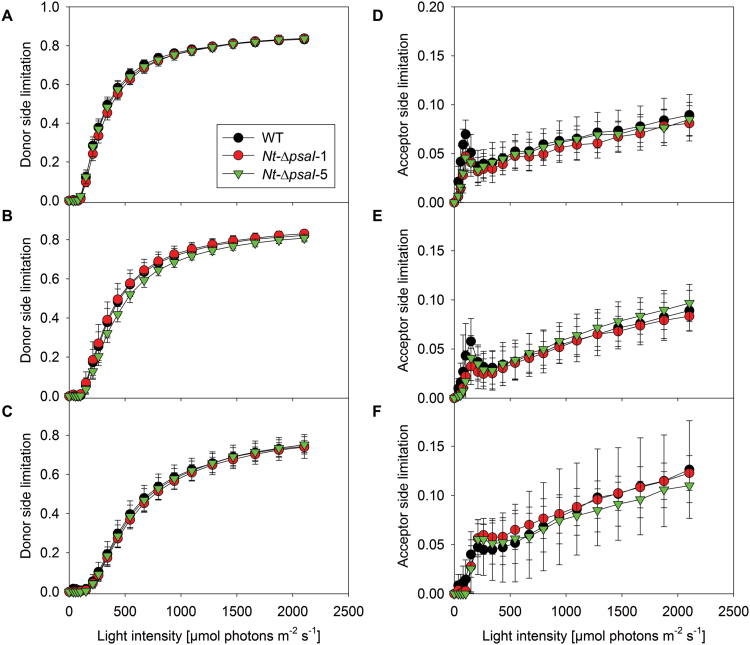
Fig. 8.
Light-response curves of the (A–C) donor-side limitation and the (D–F) acceptor-side limitation of PSI. No significant differences were observed for plants grown under low (A, D), intermediate (B, E), or high (C, F) light intensities between the wild type (WT) and the two transplastomic lines. Data are the averages of a minimum of six biological replicates from at least two independent plant cultures, and the standard deviation is shown.

