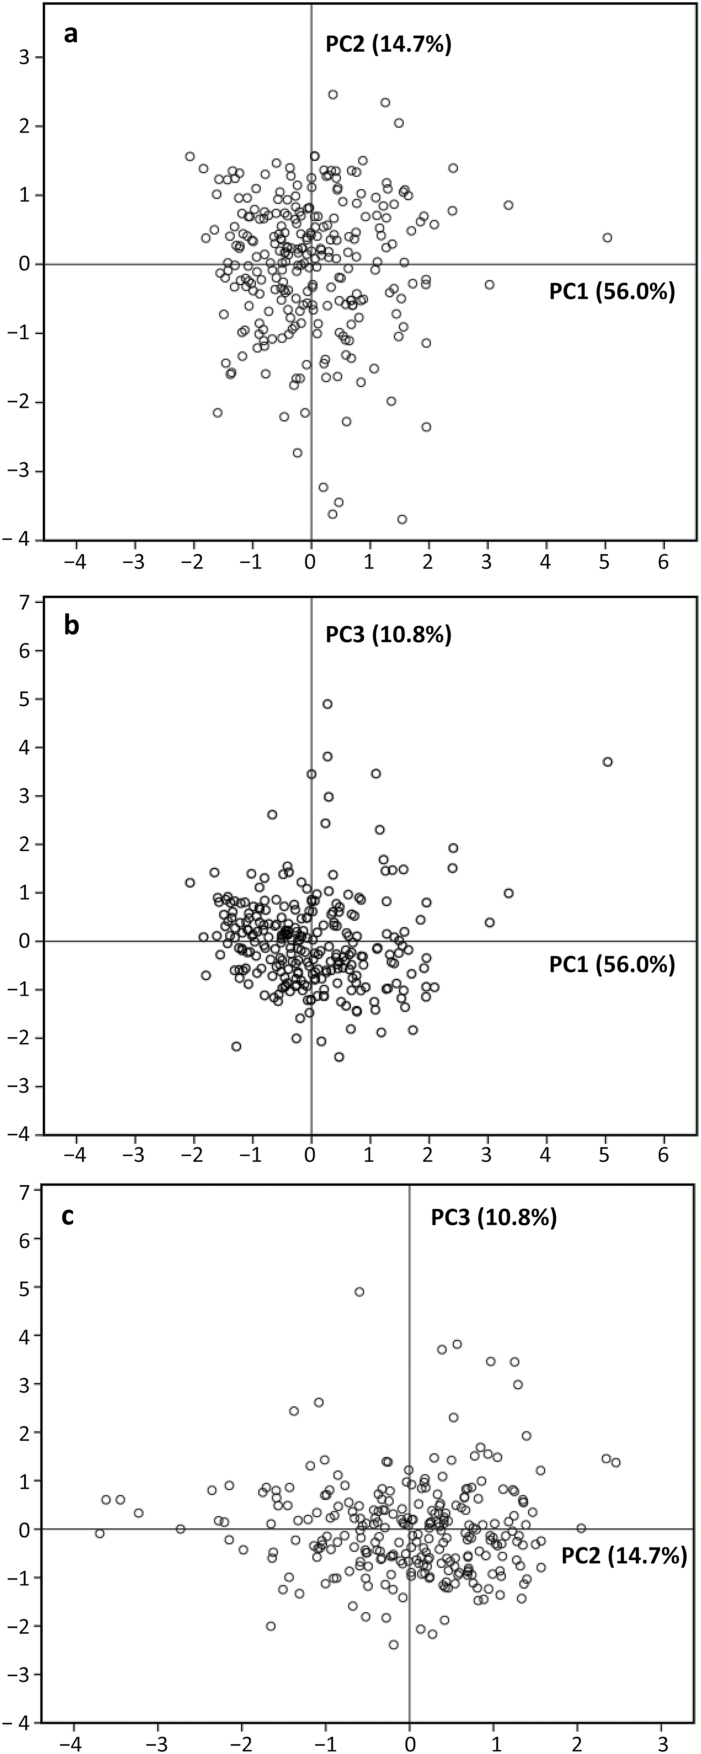
Fig. 7.
Principal component analysis of 17 selected root traits with CVs ≥0.3 among 270 chickpea genotypes grown in a semi-hydroponic phenotyping platform. The position of each genotype is shown for principal component PC1 vs. PC2 representing 70.7% of the variability (a), PC1 vs. PC3 representing 66.8% of the variability (b), and PC2 vs. PC3 representing 25.5% of the variability (c).

