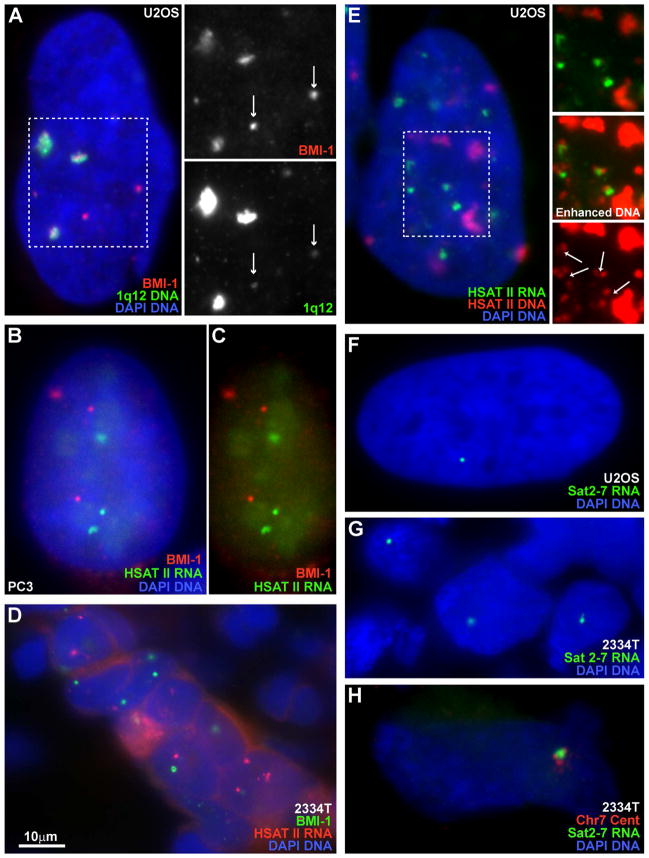
Fig 3. PRC1 aggregates on HSATII DNA at 1q12 maintaining repression while other loci become de-repressed.
A) The pUC1.77 probe labels HSATII on Chr1 and some on Chr16 (arrows), and correlates with BMI-1 “CAP” bodies. Channels from outlined region are separated at right. B–C) CAP bodies and HSATII RNA are mutually exclusive. Red and green channels of image B at right. D) CAP bodies and HSATII RNA foci in breast tumor tissue. E) HSATII RNA is expressed from small HSATII loci and not from the large 1q12 loci. Small loci are visible when DNA signal (of outlined region) is separated and enhanced at right. HSATII RNA accumulates adjacent to DNA loci (arrows). F–G) Sat2-7 probe labels only 1–2 RNA foci in U2OS cells (F) or in breast tumor #2334T (G). H) Chr7 specific centromere probe verifies Sat2-7 RNA is expressed from Chr7.

