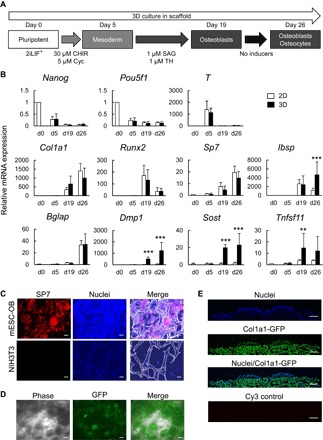
Fig. 3. Osteogenic differentiation of mESCs cultured under 2D (plates) or 3D (scaffolds) conditions.

(A) A schematic of the strategy for inducing osteogenic differentiation of mPSCs. SAG, smoothened agonist. (B) mRNA expression determined by RT-qPCR analysis in the osteogenic 2D or 3D cultures of mESCs. Data are means ± SD from six independent experiments. **P < 0.01 and ***P < 0.001 in 3D-cultured mESCs versus 2D-cultured mESCs. (C) SP7 protein expression in the osteogenic 3D culture of mESCs (mESC-OB, day 26) and NIH3T3 cultured on scaffolds (negative control). Immunostaining was performed for SP7 on frozen sections. Nuclei were stained with DAPI. Scale bars, 50 μm. (D) Green fluorescent protein (GFP) expression in the osteogenic 3D culture of 2.3-kb Col1a1-GFP mESCs (day 26). GFP signal was assessed in the whole scaffold by fluorescence microscopy. Scale bars, 100 μm. (E) Cross-sectional view of the surface of the scaffold in the osteogenic 3D culture of 2.3-kb Col1a1-GFP mESCs (day 26). Immunostaining was performed for GFP on frozen sections. Nuclei were stained with DAPI. Scale bars, 250 μm.
