
Fig. 4. Characterization of the mESC-derived cell-scaffold complex after osteogenic differentiation (day 26) and the coculture with BM cells (day 26 + 7).
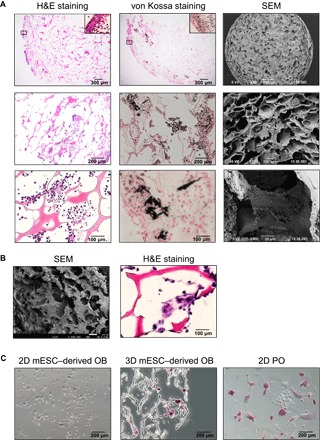
(A) Representative pictures of H&E staining, von Kossa staining with nuclear fast red, and SEM in the osteogenic 3D culture of mESCs. Insets show fivefold magnification views of regions marked by rectangular boxes. (B) Representative pictures of H&E staining and SEM in 3D cocultures of the mESC-derived osteoblast/osteocyte population and BM cells. (C) TRAP staining in cocultures of the 3D mESC– or 2D mESC–derived osteoblasts (OB) and BM cells. Coculture of PO and BM cells in 2D is shown as a positive control.