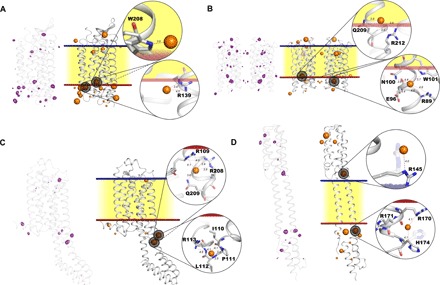
Fig. 4. Cartoon representations of the crystal structures of the four classes of MP solved using the I-SAD/I-SIRAS technique.

(A) KR2. (B) MACR (noncrystallographic dimer). (C) A2AAR-BRIL-ΔC. (D) NarQ. On the left of each representation, peaks in I-SAD anomalous difference Fourier maps [purple chicken wire, highest-resolution I-SAD data sets for each target (Table 1), contoured at the 3.5 × r.m.s. (root mean square) level] are shown superposed on the Cα backbone of the protein. On the right of each panel, the blue and red lines represent outer and inner lipidic membrane surfaces, respectively, with the hydrophobic region of the lipidic membrane represented in yellow. Iodide ions are shown as orange spheres, divided into three sizes based on the height of anomalous difference map peaks. Two iodide binding sites per crystal structure are highlighted to illustrate their environment. In (D), it is clear that protein residues may change their side-chain conformation upon binding of iodide (conformation in native structures shown as shadows).
