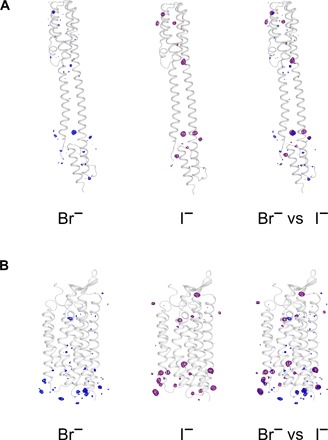
Fig. 5. Comparison of peaks in anomalous difference Fourier maps in I-SAD and Br-SAD experiments.

(A) Peaks in anomalous difference Fourier maps in Br-SAD (left) and I-SAD (middle) experiments for NarQ, with a superposition of the two maps shown on the right. (B) Peaks in anomalous difference Fourier maps in Br-SAD (left) and I-SAD (middle) experiments for KR2, with a superposition of the two maps shown on the right. Only the regions close to the proteins are shown, and the maps are contoured at the 3.5 × r.m.s. level. For both NarQ and KR2, the anomalous difference Fourier maps shown are those calculated using anomalous differences in the individual I-SAD data sets of the highest resolution, as detailed in Table 1, and in the merged Br-SAD data sets, as detailed in Table 5.
