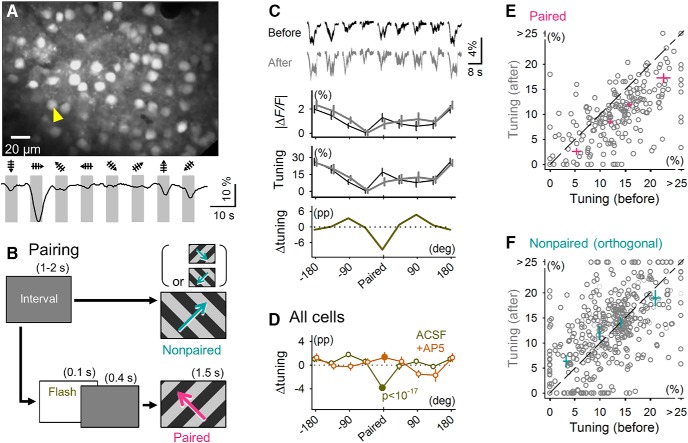
Figure 2.
Flash conditioning induces long-term suppression of visually evoked calcium responses in V1 neurons. A, Two-photon image of Fura-2–labeled L2/3 neurons. The bottom trace indicates a raw fluorescence change (|ΔF/F|) in the neuron marked by the yellow arrowhead in response to gratings drifting in eight directions of motion. B, Diagram of the stimulus pairing protocol. Flashes were applied 0.4 s before showing the gratings drifting in a specific direction (paired). This flash-to-drifting grating stimulus pairing was repeated 30 times within a period of 420 s. During stimulus pairing, no flashes were applied preceding gratings that drifted in other directions (nonpaired). C, Stimulus pairing-induced changes in the calcium response of a representative cell. From top to bottom: means ± SEMs (shown as the area) of visually evoked fluorescence traces for all eight directions, mean ± SEM response amplitudes, normalized tuning curves ± SEM, 5–10 min before and 5–10 min after stimulus pairing, and tuning curve change (Δtuning; pp, percentage point). The top traces are ordered according to the labeling of the x-axis of the bottom plot. D, Δtuning was calculated as means ± SEMs of all imaged cells from mice with (+AP5, n = 113 neurons from 4 mice) or without (aCSF, n = 214 neurons from 10 mice) local application of AP5 to the V1. E, Distribution of raw tuning values for the paired stimuli versus the initial tuning value. Each circle indicates a single cell. Cross symbols represent means ± SEMs for data points in quartile sections. The line is the diagonal. F, Same as in E but for the drifting gratings orthogonal to the paired stimuli.

