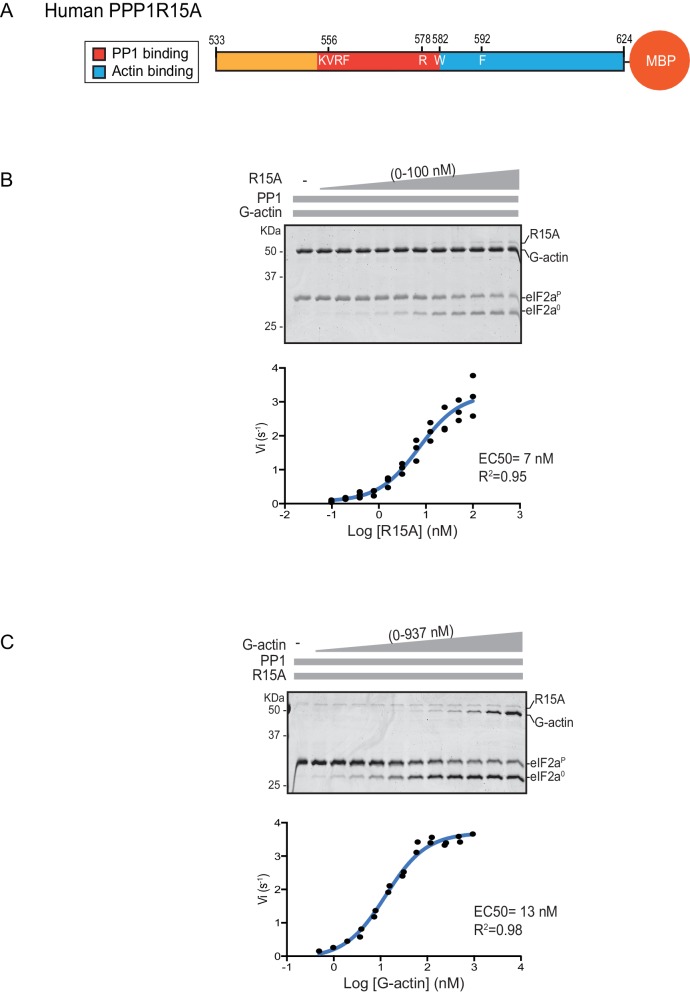
Figure 2. eIF2α-P dephosphorylation kinetics as a function of human PPP1R15A533-624 and G-actin concentration.
(A) Schema of the human PPP1R15A533-624 construct used. The C-terminal Maltose Binding Protein (MBP) component, which stabilizes the fusion protein, is noted. (B) Upper panel. Coomassie-stained PhosTag-SDS-PAGE tracking the dephosphorylation of eIF2αP to eIF2α0 in 20 min dephosphorylation reactions constituted with eIF2αP [2 µM], PP1 [0.625 nM], G-actin [1.5 µM] and an escalating concentration of PPP1R15A533-624. Shown is a representative of three independent experiments performed. Lower panel: Semi-log10 plot of the initial velocity of eIF2αP dephosphorylation as a function of PPP1R15A533-624 concentration derived from three repeats (one shown above). The EC50 for PPP1R15A533-624 was calculated using the agonist fitting function on GraphPad Prism V7. (C) Upper panel. As in ‘B’ but dephosphorylation of eIF2αP to eIF2α0 was carried out in the presence of a fixed concentration of PPP1R15A533-624 [50 nM] and an escalating concentration of G-actin. Shown is a representative of two independent experiments performed. Lower panel: Semi-log10 plot of initial velocity as a function of G-actin concentration derived from two repeats (one shown above).

