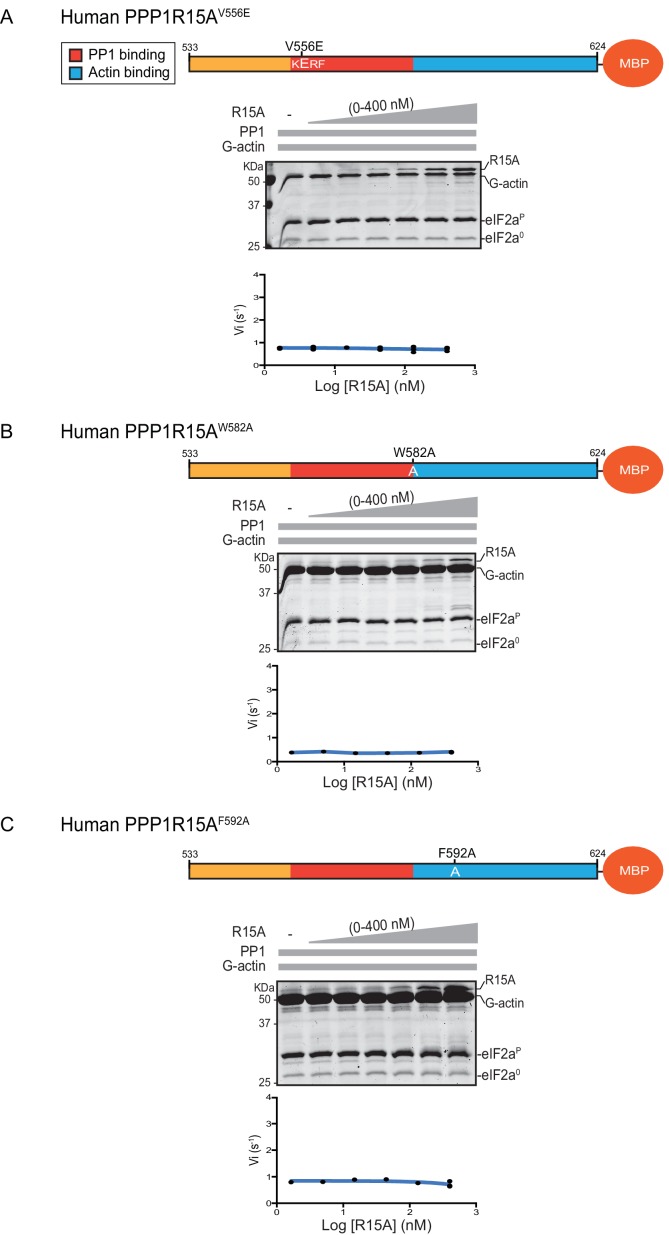
Figure 3. eIF2α-P dephosphorylation by ternary complexes constituted with human PPP1R15A(533-624)V556E, PPP1R15A (533-624)W582A or PPP1R15A (533-624)F592A.
(A) Coomassie-stained PhosTag-SDS-PAGE tracking the dephosphorylation of eIF2αP to eIF2α0 as in Figure 2 above, but with PP1[32 nM], G-actin [400 nM] and an escalating concentration of mutant human PPP1R15A(533-624)V556E. Shown is a representative of three independent experiments performed. The position of the mutation is provided in the schema above. The plot of initial velocity as a function of PPP1R15A(533-624)V556E derived from three repeats (one shown) is below the SDS-PAGE image. (B) As in ‘A’ above but using human PPP1R15A(533-624)W582A and G-actin [3.7 µM](Note: only the highest concentration of PPP1R15A was repeated three times). (C) As in ‘A’ above but using human PPP1R15A(533-624)F592A and G-actin [3.7 µM] (Note: only the highest concentration of PPP1R15A was repeated three times).

