. 2017 Apr 20;6:e21697. doi: 10.7554/eLife.21697

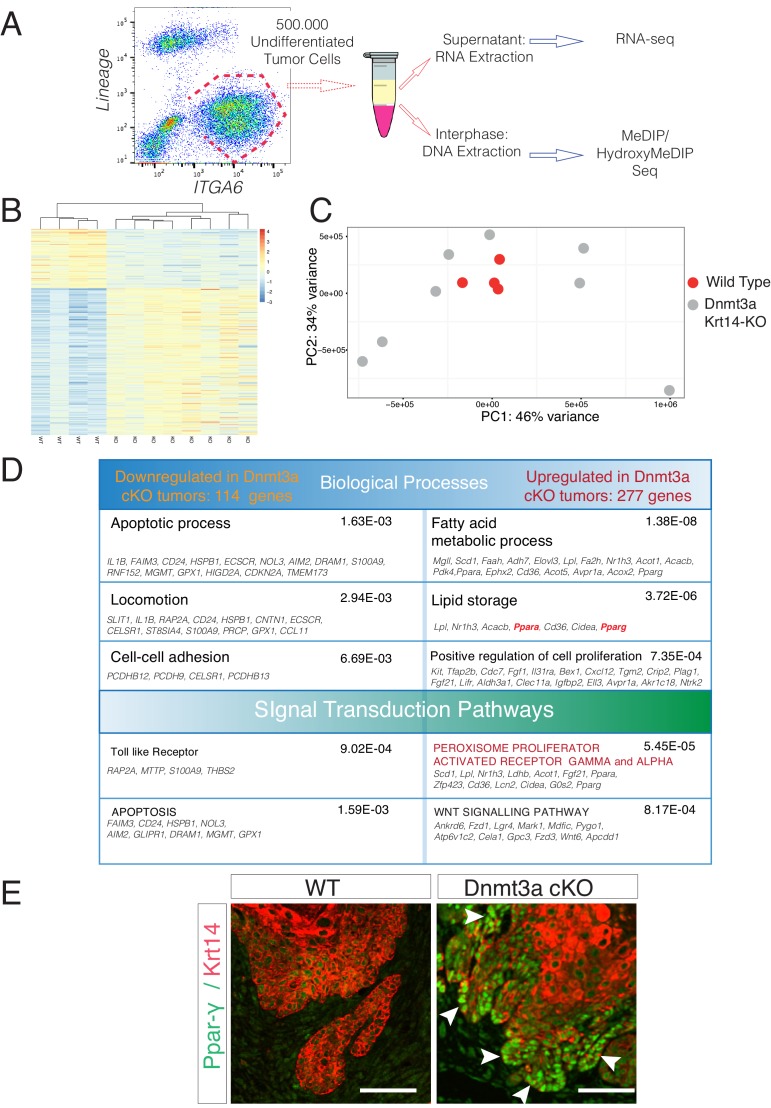
Figure 3. Deletion of Dnmt3a results in increased tumor heterogeneity, and upregulation of genes related to lipid metabolism.

(A) Schematic representation of FACS sorting strategy to isolate both RNA and DNA from Itga6pos cells within the tumors. (B) Heatmaps representing gene expression (rlog transformed values) of the 391 differentially expressed genes between wild type and Dnmt3a-cKO sorted tumor cells. (C) Two-dimensional principal-component analysis (PCA) of RNA-seq samples from wild-type (n = 4) and Dnmt3a-cKO (n = 8) Itga6bright sorted tumor cells. (D) Gene ontology analysis using Genomatix Online Software of the 114 downregulated and 277 upregulated genes in Dnmt3a-cKO tumors, divided by biological processes and over-represented signal transduction pathways. (E) Immunofluorescence staining for Krt14 and PPAR-γ of skin tumors from wildtype and Dnmt3a-cKO animals.

DOI: http://dx.doi.org/10.7554/eLife.21697.013

Figure 3.

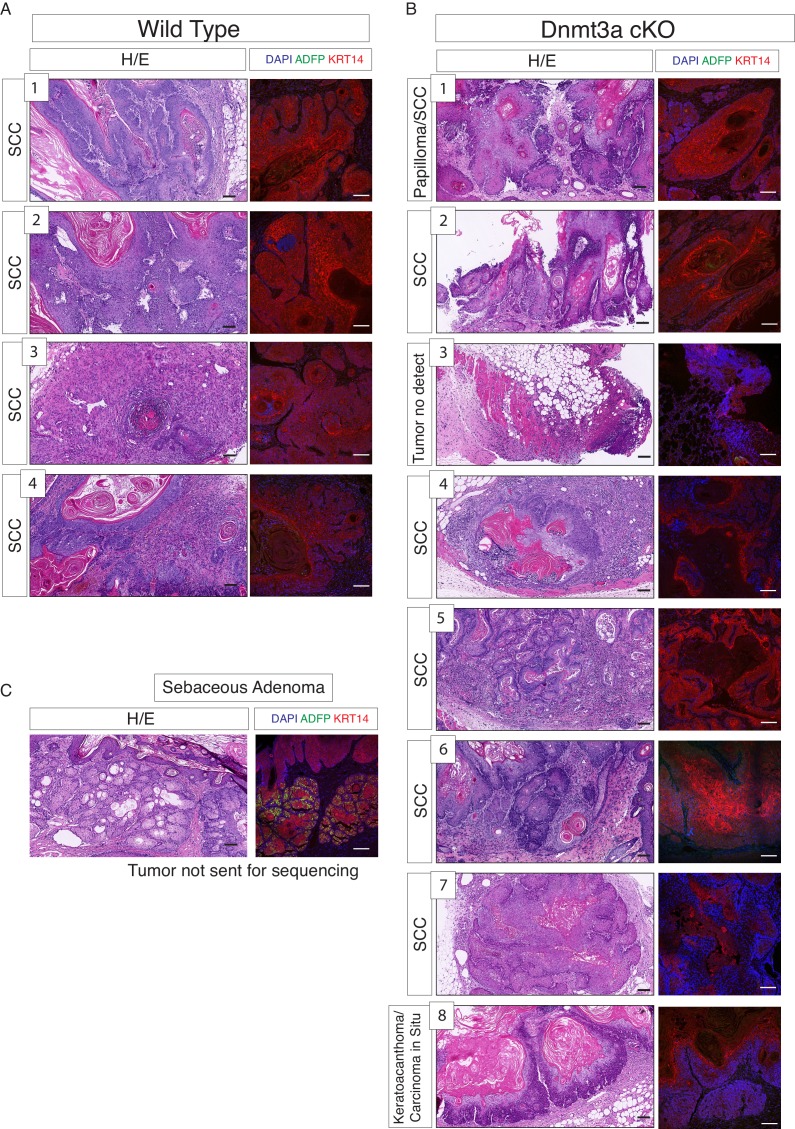
Figure 3—figure supplement 1. RNA samples submitted for sequencing were obtained from tumors scored predominantly as squamous cell carcinomas in wild-type and Dnmt3a-cKO mice.

Figure 3—figure supplement 1.

(A) Hematoxylin/eosin staining from the four wild-type tumors used for RNA-seq. (B) Hematoxylin/eosin staining from the eight Dnmt3a-cKO tumors analyzed for RNA-seq. In A and B, immunofluorescence staining shown correspond to DAPI, ADFP (to ensure that no sebaceous adenomas were collected), and Krt14. (C) Representative hematoxylin/eosin staining and immunofluorescence of DAPI, ADFP and Krt14, of sebaceous adenomas eliminated from the RNA-seq study. Scale bar is 100 μm.
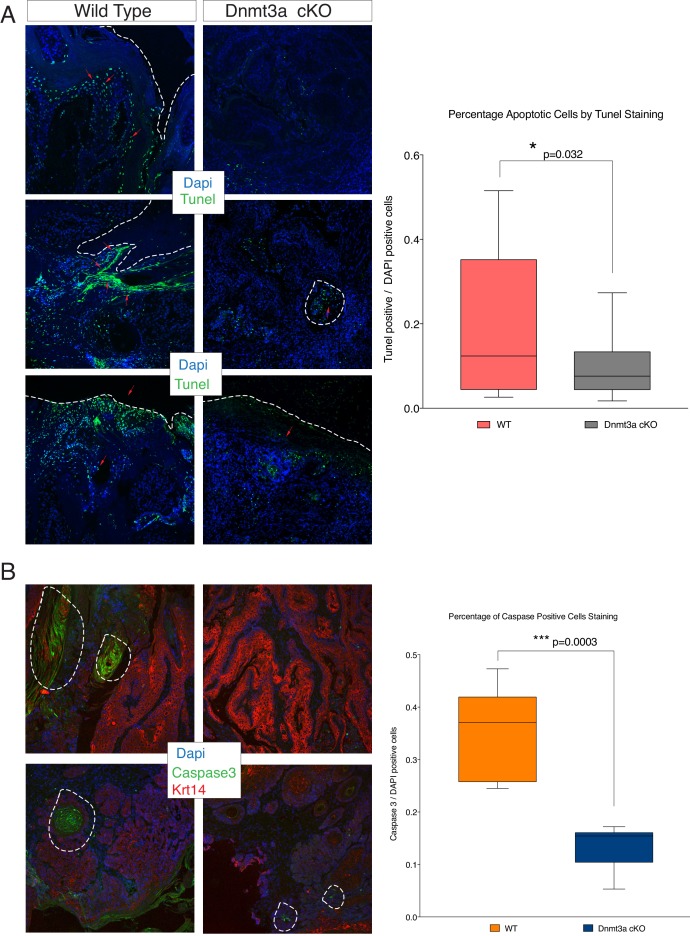
Figure 3—figure supplement 2. Loss of Dnmt3a results in a reduction of apoptosis in skin tumors.

Figure 3—figure supplement 2.

(A) Representative images for TUNEL staining to detect apoptotic cells in skin tumors isolated from wild type and Dnmt3a-cKO animals. The right graph shows the quantification of the Tunel staining in wild type (n = 12) and Dnmt3a-cKO (n = 17) tumors. (B) Representative images for active Caspase-3 staining to visualize apoptotic cells in skin tumors isolated from wild-type and Dnmt3a-cKO animals. The right panel shows the quantification of the staining in wild-type (n = 6) and Dnmt3a-cKO (n = 6) tumors. Scale bar is 100 μm.
Figure 3—figure supplement 2—Source Data 1. Data related to Figure 3—figure supplement 2A–B.
Number of apoptotic cells (expressed in percentage of TUNEL or CASPASE-3 positive cells/DAPI positive cells) in wild-type and Dnmt3a-cKO tumors.
DOI: 10.7554/eLife.21697.016
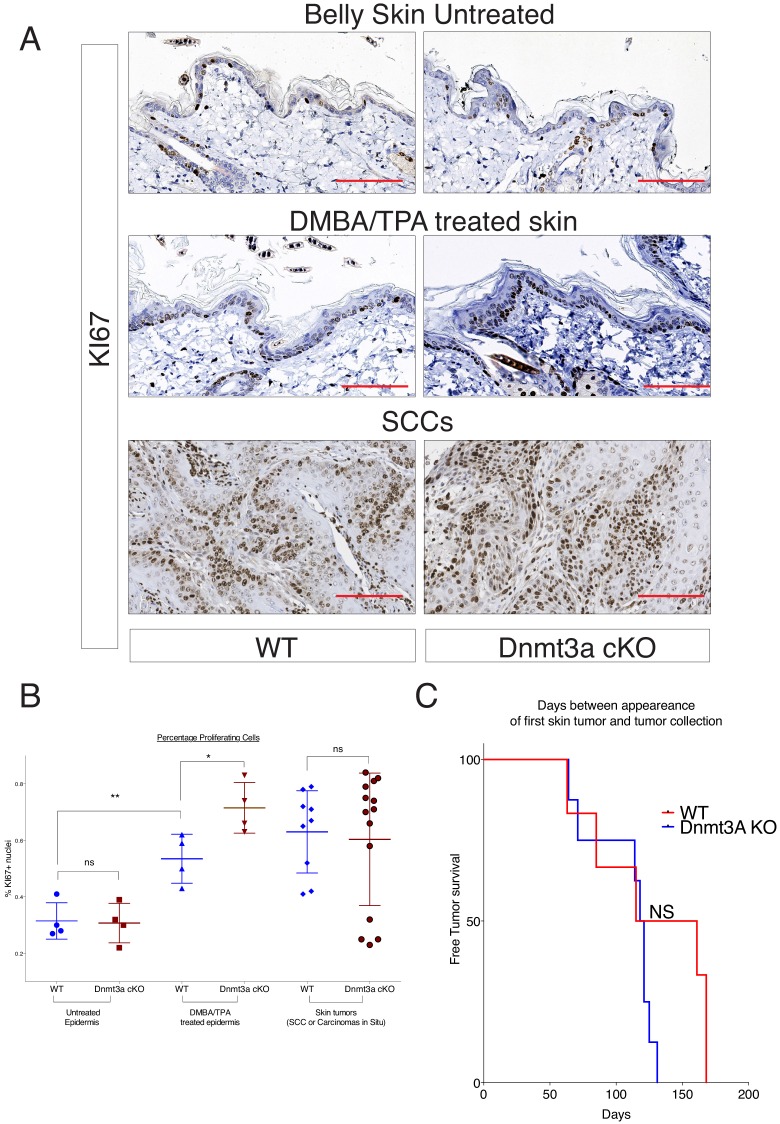
Figure 3—figure supplement 3. DMBA/TPA treatment induces an increase in cellular cell proliferation in Dnmt3a-cKO animals.

Figure 3—figure supplement 3.

(A) Representative images of KI67 staining in treated or untreated back skin, and in skin tumors, of Dnmt3a-cKO and wild-type littermates. (B) Quantification of KI67 staining using the TMarker software, showing the percentages of KI67-positive cells in the different conditions studied and normalized to the proliferation in the interfollicular epidermis of wild-type mice. Scale bar is 100 μm.
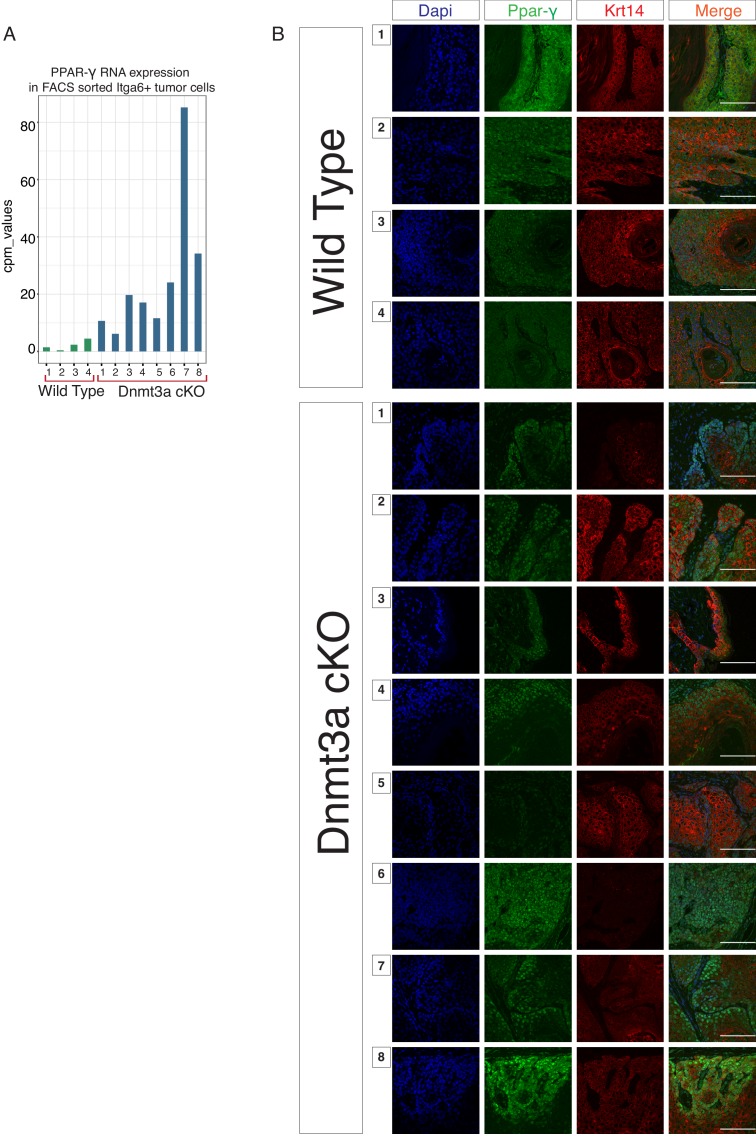
Figure 3—figure supplement 4. Dnmt3a-KO tumors express high levels of PPAR-γ.

Figure 3—figure supplement 4.

(A) CPM (Count per Million Read) values of the mRNA encoding for PPAR-γ obtained from the RNA-sequencing of the 12 tumors studied. (B) Representative immunofluorescence staining for DAPI, PPAR-γ and Krt14 in all the 12 tumors used for the RNA-sequencing experiment. Scale bar is 100 μm.
Figure 3—figure supplement 4—Source Data 1. Data related to Figure 3—figure supplement 4B.
Number of proliferative cells (expressed as the percentage of KI67+/all nuclei) in the untreated epidermis, DMBA-treated epidermis, and in the tumors, from wild-type and Dnmt3a-cKO mice.
DOI: 10.7554/eLife.21697.019