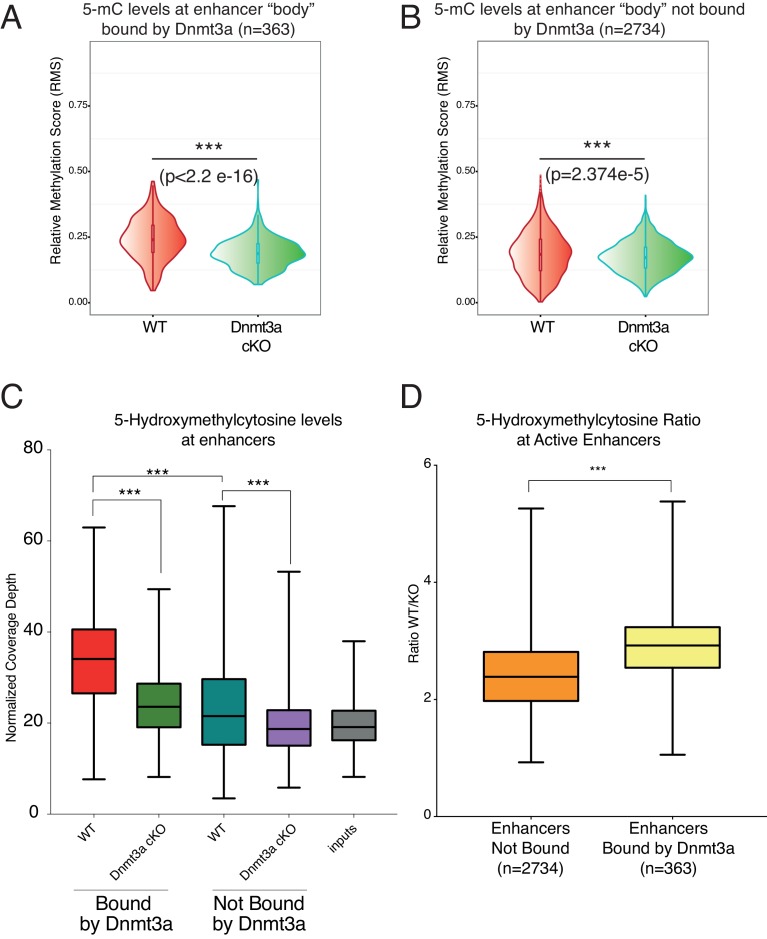
Figure 5. Depletion of Dnmt3a leads to loss of DNA methylation and hydroxymethylation around its target enhancers.
(A) Relative methylation score (CpG count) measured around 363 enhancers bound by Dnmt3a (–5 kb, +5 kb) from independent biological replicates of FACS sorted tumor cells from wild type (n = 2) and Dnmt3a-cKO (n = 2) (p<2.2 × 10⁻¹⁶). (B) Relative methylation score (CpG count) measured around 2734 enhancers not bound by Dnmt3a (–5 kb, +5 kb) from independent biological replicates of FACS-sorted tumor cells from wild-type (n = 2) and Dnmt3a-cKO (n = 2) animals (p=2.374e−5). (C) Global levels of 5-hmC at enhancer center (–2Kb, + 2 Kb) were quantified using HOMER software in independent biological replicates of FACS sorted tumor cells from wild-type (n = 2) and Dnmt3a-cKO (n = 2) mice at enhancers bound or not by Dnmt3a. (D) Ratio between the 5-hmC levels at enhancers bound or not by Dnmt3a in wild-type and Dnmt3a-cKO tumor cells.


