. 2017 Apr 11;6:e22194. doi: 10.7554/eLife.22194

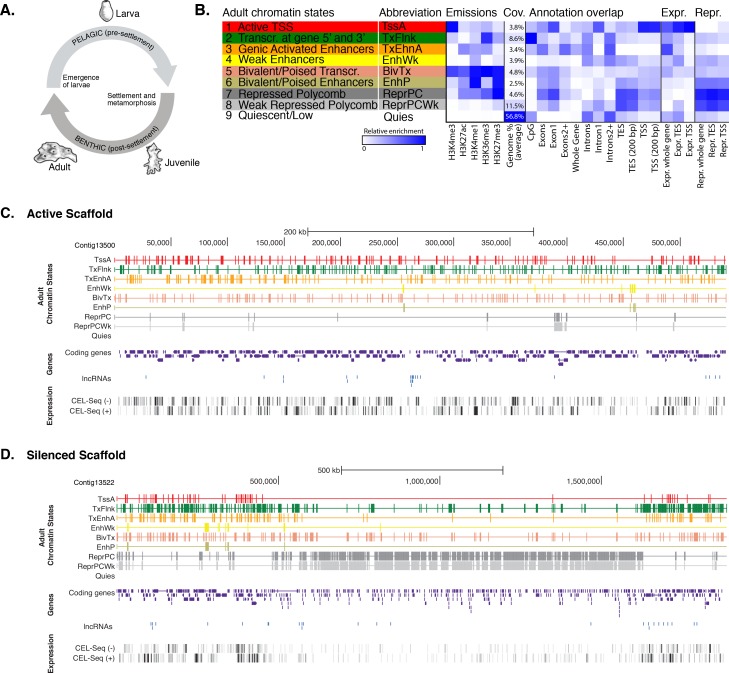
Figure 1. Chromatin states in Amphimedon.

(A) Schematic representation of Amphimedon life cycle. Larvae (oval shaped, 300–500 µm long) emerge from maternal brood chambers and then swim in the water column before they develop competence to settle and initiate metamorphosis into a juvenile. The juvenile body plan, which displays the hallmarks of the adult body plan, including an aquiferous system with canals, choanocytes chambers and oscula, is the outcome of the dramatic reorganization of the radially-symmetrical, bi- or trilayered larva. This juvenile will then grow and mature into a benthic adult (ranging from 10–30 cm3) (Degnan et al., 2015; Edgar et al., 2002). (B) Definition and enrichments for a 9-state Hidden Markov Model based on five histone PTMs (H3K4me3, H3K27ac, H3K4me1, H3K36me3 and H3K27me3) in adult Amphimedon. From left to right: chromatin state definitions, abbreviations, histone PTM probabilities, genomic coverage, protein-coding gene functional annotation enrichments, expressed (Expr.) and repressed (Repr.) protein-coding gene enrichments. Blue shading indicates intensity, scaled by column. (C) Adult chromatin state annotations on gene rich highly transcribed (active) scaffold (contig13500) showing the predominance of ‘TssA’, ‘TxFlnk’, and ‘TxEnhA’ states. For the definition of chromatin states see panel (A). Coding genes (purple) and long non-coding RNAs (blue) are shown, along with signal coverage tracks showing CEL-seq expression in adult. A grey scale indicates CEL-seq expression level: white (no-expression); black (highest expression). (D) Adult chromatin state annotations on a predominantly silenced scaffold (contig13522 from 500,000 to 1,500,000 bp) showing the prevalence of ‘ReprPC’ and ‘ReprPCWk’ states. For the definition of chromatin states see panel (A). Coding genes (purple) and long non-coding RNAs (blue) are shown, along with signal coverage tracks showing CEL-seq expression in adult. A grey scale indicates CEL-seq expression level: white (no-expression); black (highest expression).

DOI: http://dx.doi.org/10.7554/eLife.22194.003

Figure 1—source data 1. Histone H3 covalent post-translation modifications and RNA Polymerase II investigated in this study and their typical genomic localization relative to coding genes and regulatory regions in bilaterian model organisms.
DOI: 10.7554/eLife.22194.004
Figure 1—source data 2. Histone H3 sequences used to generate Figure 1—figure supplement 1.
DOI: 10.7554/eLife.22194.005
Figure 1—source data 3. BLASTp search outcome of the relevant histone methyltransferases and acetyltransferases against Amphimedon queenslandica proteins (NCBI nr database; E-value <1e-09).
DOI: 10.7554/eLife.22194.006
Figure 1—source data 4. Summary statistics and quality metrics of the ChIP-seq datasets used in this study.
See also Materials and methods for preprocessing of ChIP-seq datasets procedure.
DOI: 10.7554/eLife.22194.007
Figure 1—source data 5. Validation of the ChIP-seq results by ChIP-quantitative PCRs (ChIP-qPCRs).
DOI: 10.7554/eLife.22194.008

Figure 1.

Figure 1—figure supplement 1. Multiple sequence alignment of various eukaryotic histone H3 proteins (1–136 amino acids), produced by using ClustalO (RRID:SCR_001591) (Sievers et al., 2011).

Figure 1—figure supplement 1.

Note that the entire amino acid sequence of histone H3 is highly conserved across eukaryotes. Sponge sequence is highlighted. The amino acid sequences used to generate the alignment are also provided in Figure 1—source data 2.
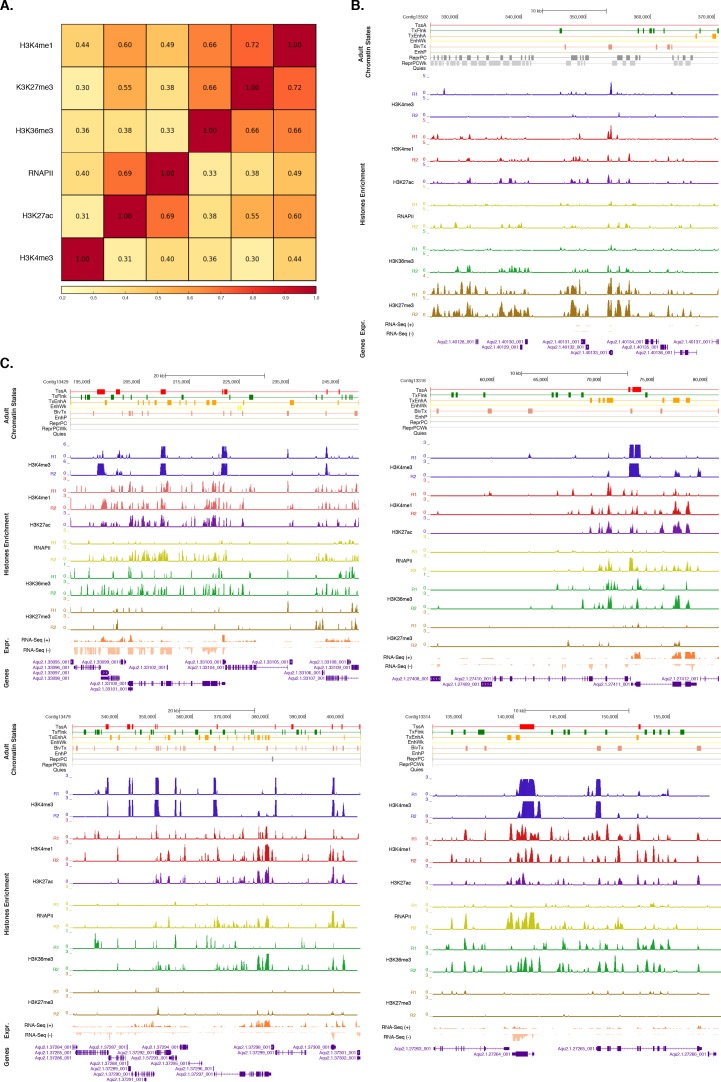
Figure 1—figure supplement 2. Assessment of reproducibility for biological replicates between histone modifications andRNA Polymerase II.

Figure 1—figure supplement 2.

(A) Pearson correlation coefficients between histone modifications and RNA Polymerase II (RNAPII). Adult experiments (combined biological replicates) are shown. Underlying colors indicate the similarity between the different datasets. Note that H3K36me3 was flagged for low signal to noise, potentially explaining the somewhat high correlation with H3K27me3 (see Figure 1—source data 4). However, this does not affect the conclusions of the paper in any way. (B) Adult chromatin state annotations on a predominantly silenced region. For the definition of chromatin states see Figure 1A. Coding genes (purple) are shown, along with input DNA-normalized coverage of each biological replicate (R1 and R2) of different histone modifications and RNA-seq expression. (C) Same as (B) for highly transcribed regions. Apart from RNAPII replicate 1, which did not pass the quality threshold required so it has been excluded from all further analyses (see Figure 1—source data 4), we obtained highly reproducible data sets.
Figure 1—figure supplement 3. Neighborhood positional enrichment plots of adult chromatin states around transcription start site (TSS) and transcription end site (TES) of proteins-coding genes, produced by ChromHMM (Ernst and Kellis, 2012).

Figure 1—figure supplement 3.

For the definition of adult chromatin states see Figure 1A. (A) Positional enrichments in 100 bp genomic bins around the TSS and TES (±1 kb) of expressed protein-coding genes in adult Amphimedon. (B) Same as (A) for repressed protein-coding genes in adult Amphimedon. Blue shading indicates intensity.
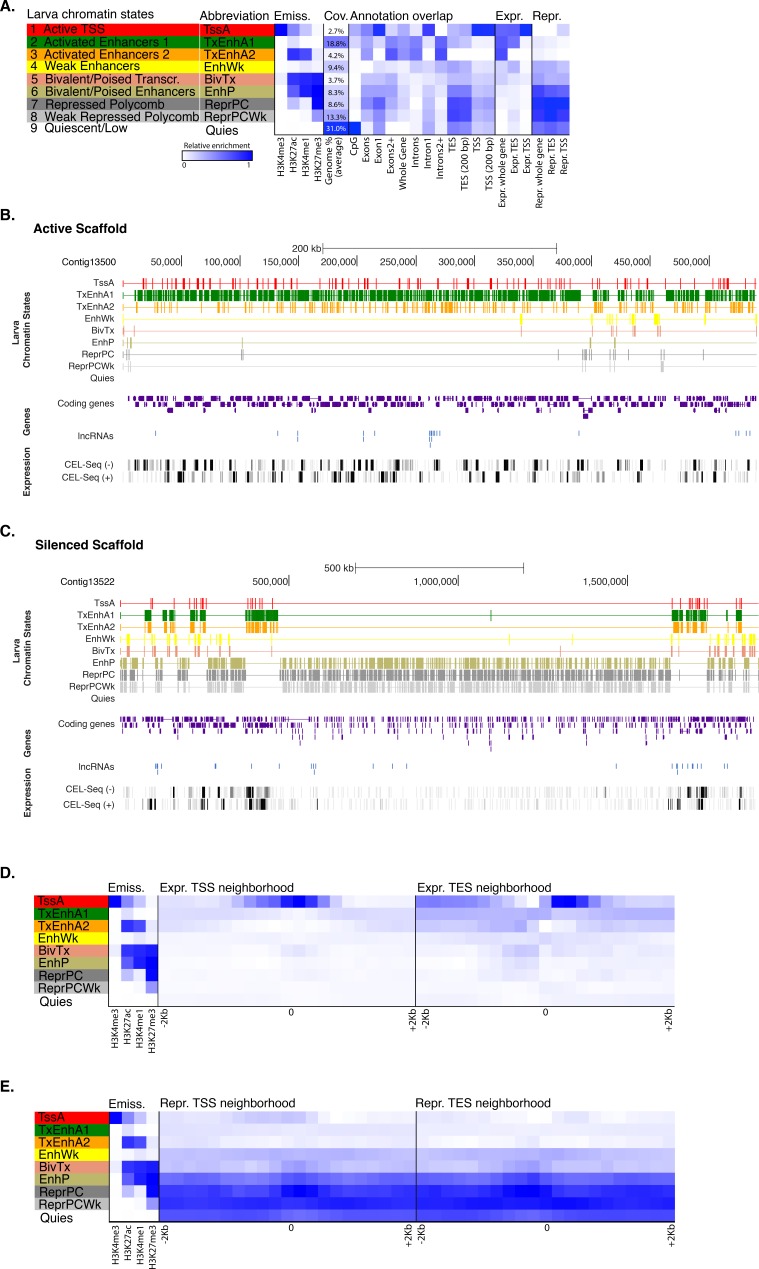
Figure 1—figure supplement 4. Chromatin states in Amphimedonlarva.

Figure 1—figure supplement 4.

(A) Definition and enrichments for a 9-state Hidden Markov Model based on four histone PTMs (H3K4me3, H3K27ac, H3K4me1, H3K27me3) in Amphimedon larva. From left to right: chromatin state definitions, abbreviations, histone PTM probabilities, genomic coverage, protein-coding gene functional annotation enrichments, expressed (Expr.) and repressed (Repr.) protein-coding gene enrichments. Blue shading indicates intensity, scaled by column. (B) Chromatin state annotations on a gene rich highly transcribed (active) scaffold (contig13500) as in Figure 1. For the definition of chromatin states see panel (A). Coding genes (purple) and long non-coding RNAs (blue) are shown, along with signal coverage tracks showing CEL-seq expression in larva. A grey scale indicates CEL-seq expression level: white (no-expression); black (highest expression). (C) Chromatin state annotations on a predominantly silenced scaffold (contig13522 from 500,000 to 1,500,000 bp) as in Figure 1. For the definition of chromatin states see panel (A). Coding genes (purple) and long non- coding RNAs (blue) are shown, along with signal coverage tracks showing CEL-seq expression in adult. A grey scale indicates CEL-seq expression level: white (no-expression); black (highest expression). (D) Neighborhood positional enrichments in 100 bp genomic bins around the TSS and TES (±1 kb) of expressed protein-coding genes in larva. (E) Same as (D) for repressed protein-coding genes in larva. Blue shading indicates intensity.