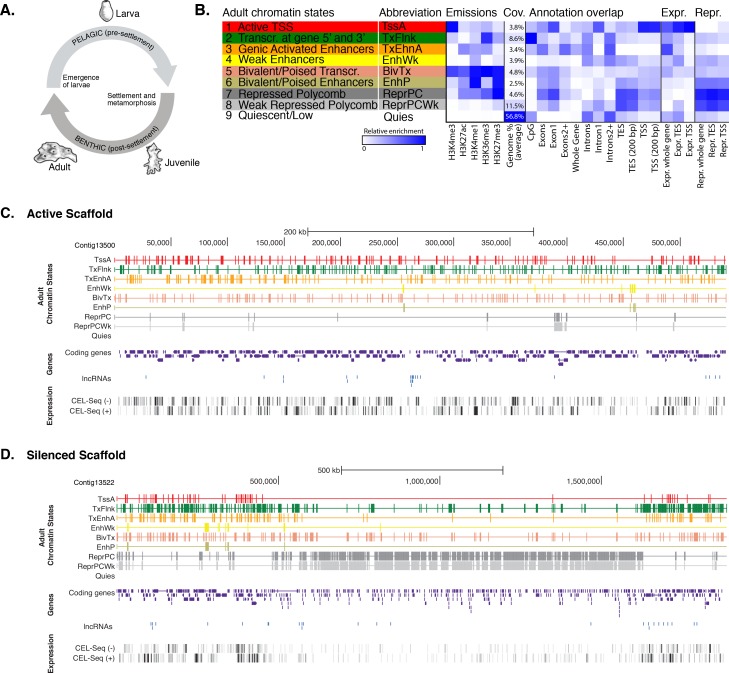
Figure 1. Chromatin states in Amphimedon.
(A) Schematic representation of Amphimedon life cycle. Larvae (oval shaped, 300–500 µm long) emerge from maternal brood chambers and then swim in the water column before they develop competence to settle and initiate metamorphosis into a juvenile. The juvenile body plan, which displays the hallmarks of the adult body plan, including an aquiferous system with canals, choanocytes chambers and oscula, is the outcome of the dramatic reorganization of the radially-symmetrical, bi- or trilayered larva. This juvenile will then grow and mature into a benthic adult (ranging from 10–30 cm3) (Degnan et al., 2015; Edgar et al., 2002). (B) Definition and enrichments for a 9-state Hidden Markov Model based on five histone PTMs (H3K4me3, H3K27ac, H3K4me1, H3K36me3 and H3K27me3) in adult Amphimedon. From left to right: chromatin state definitions, abbreviations, histone PTM probabilities, genomic coverage, protein-coding gene functional annotation enrichments, expressed (Expr.) and repressed (Repr.) protein-coding gene enrichments. Blue shading indicates intensity, scaled by column. (C) Adult chromatin state annotations on gene rich highly transcribed (active) scaffold (contig13500) showing the predominance of ‘TssA’, ‘TxFlnk’, and ‘TxEnhA’ states. For the definition of chromatin states see panel (A). Coding genes (purple) and long non-coding RNAs (blue) are shown, along with signal coverage tracks showing CEL-seq expression in adult. A grey scale indicates CEL-seq expression level: white (no-expression); black (highest expression). (D) Adult chromatin state annotations on a predominantly silenced scaffold (contig13522 from 500,000 to 1,500,000 bp) showing the prevalence of ‘ReprPC’ and ‘ReprPCWk’ states. For the definition of chromatin states see panel (A). Coding genes (purple) and long non-coding RNAs (blue) are shown, along with signal coverage tracks showing CEL-seq expression in adult. A grey scale indicates CEL-seq expression level: white (no-expression); black (highest expression).
DOI: http://dx.doi.org/10.7554/eLife.22194.003


