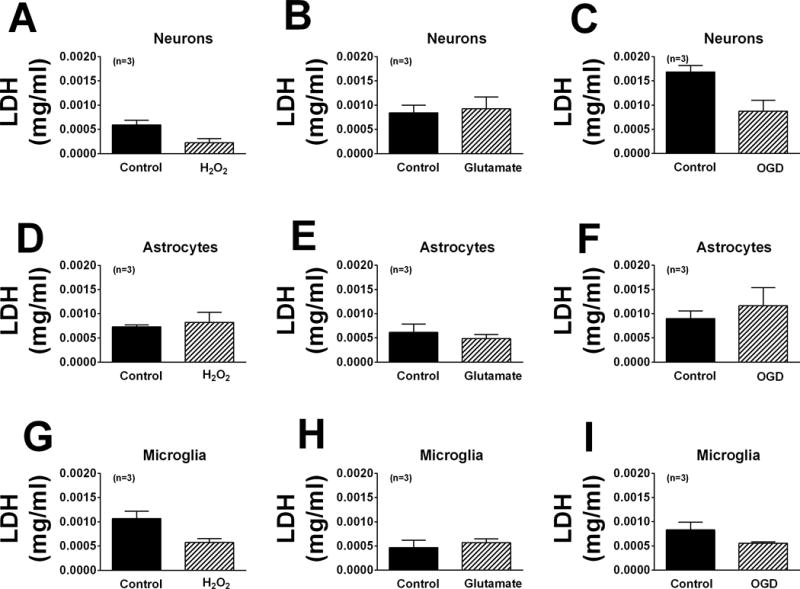
Figure 3.

Bar graphs illustrate the amount of lactic acid dehydrogenase (LDH) in the medium of neurons (A–C), astrocytes (D–F) and microglia (G–I) treated without or with H2O2 (40 μM; A, D, G), glutamate (10 μM; B, E, H) or OGD (C, F, I). None of the injurious stimuli increased LDH release compared with untreated cells.
