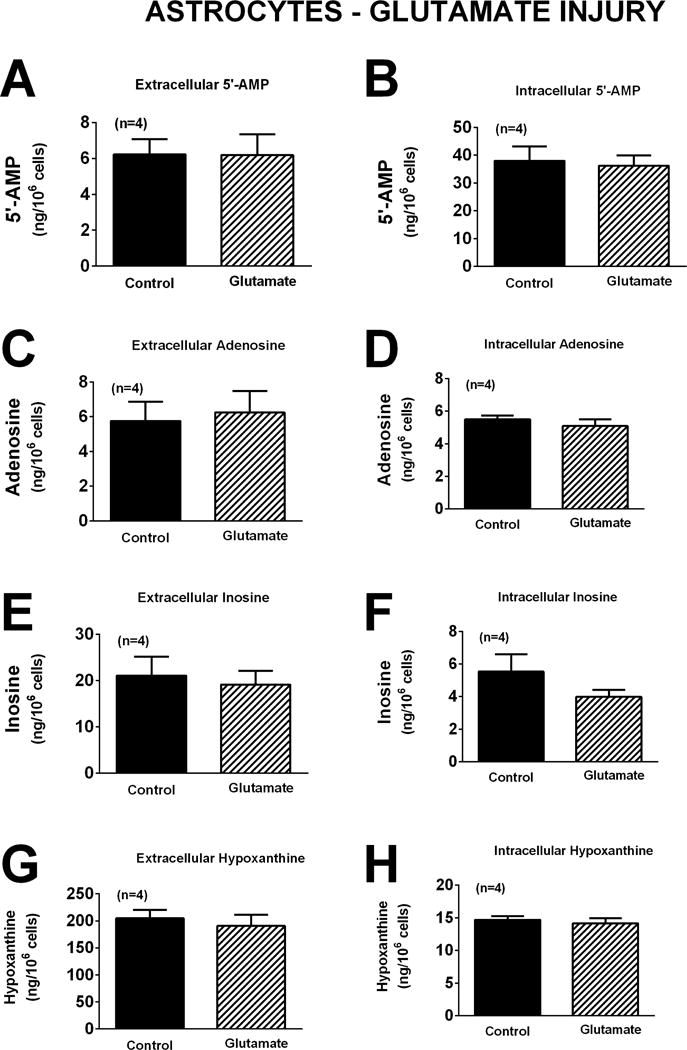
Figure 8.

Bar graphs depict the effects of glutamate (10 μM) for one hour on extracellular levels of 5′-AMP (A), adenosine (C), inosine (E), and hypoxanthine (G) and intracellular levels of 5′-AMP (B), adenosine (D), inosine (F), and hypoxanthine (H) in astrocytes. Values represent mean ± SEM.
