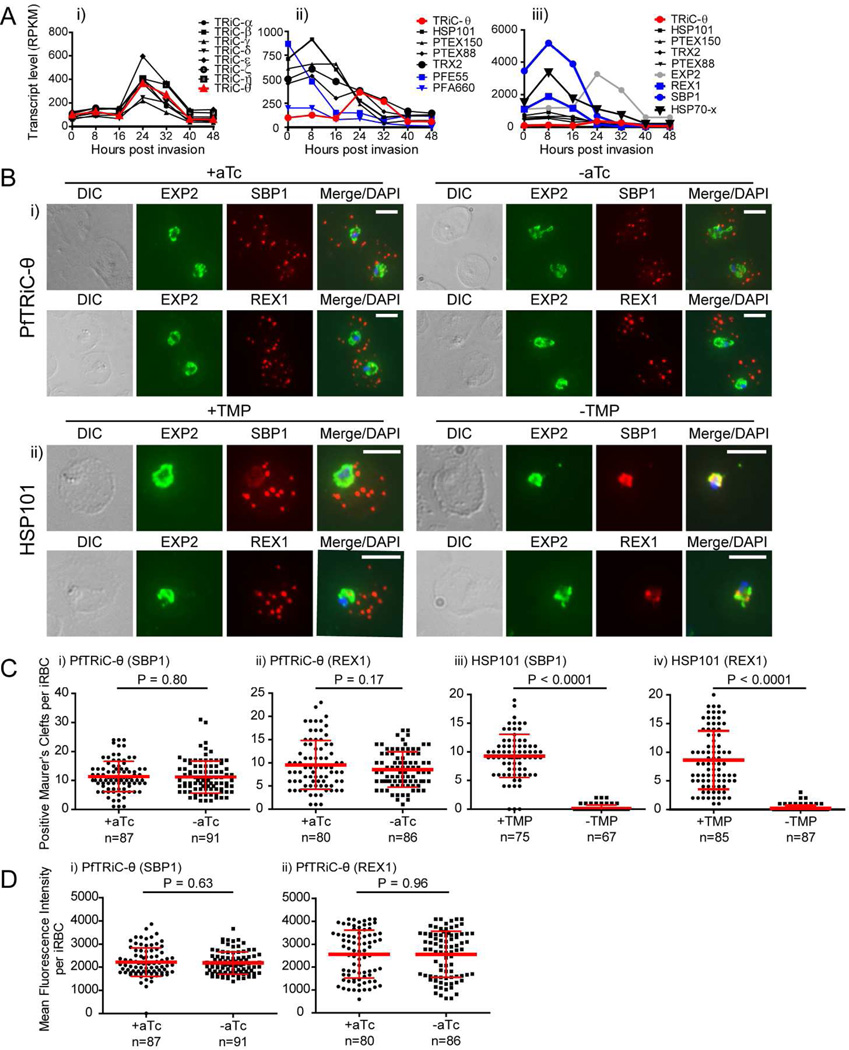
Figure 6. Loss of PfTRiC-θ does not alter export of PfSBP1 or PfREX1.
A, Transcript levels determined using RNA sequencing, from synchronized Plasmodium falciparum 3D7 parasites, expressed as Reads Per Kilobase of exon model per Million mapped reads (RPKM; scale is different between panels). Data from Otto et al. dataset (Otto et al., 2010) as extracted from PlasmoDB (Aurrecoechea et al., 2009). i) PfTRiC subunits (black) and PfTRiC-θ (red), ii) Components of the Plasmodium translocon of exported proteins (PTEX; black), PfTRiC-θ (red) and exported HSP40s (PFE55 and PFA660 abbreviations as per (Kulzer et al., 2010; Kulzer et al., 2012); blue), iii) Exported proteins PfSBP1 and PfREX1 (blue), PfEXP2 (gray), components of the Plasmodium translocon of exported proteins (PTEX; black), PfTRiC-θ (red) and PfHSP70-x (bold black). B, IFA of acetone-fixed ring-stage infected RBC. i) PfTRiC-θ ± 0.5 µM aTc, ii) HSP101 ± 10 µM trimethoprim (TMP). DAPI stains the parasite nuclei and PfEXP2 delineates the parasite parasitophorous vacuole compartment. Scale bars = 5 µm. Data are representative of two independent assays. DIC = differential interference contrast. C, The number of PfSBP1-(i,iii) and PfREX1-(ii,iv) positive Maurer’s clefts were quantified using Volocity software in the PfTRiC-θ-MYC aptamer tagged lines grown ± 0.5 µM aTc (i,ii), and the HSP101-HA tagged lines grown ± 10 µM TMP (iii,iv). D, The mean fluorescence intensity of the total PfSBP1 (i) or PfREX1 (ii) signal was quantified in the PfTRiC-θ-MYC clone B8 aptamer-tagged line grown ± 0.5 µM aTc. Data for C and D are pooled from two independent experiments, with mean values ± standard deviation shown. P values are the results of two-tailed t-test.

