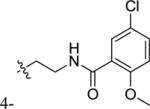
Table 7.
Scaffold 5B.
| R1 | R2 | IC50 (95% CI), μM | Hill slope (95% CI) | |
|---|---|---|---|---|
| 5bg | -H |

|
weak inhibitora | |
| 5bh | -H |
|
136 (83 – 223) | −0.8 (−1.2 ; −0.5) |
| 5bi | 4-CH3 |

|
inactivea | |
| 5bj | 4-CH3 |

|
inactivea | |
| 5bk | 4-CH3 |

|
inactivea | |
| 5bl | 4-CH3 |

|
inactivea | |
| 5bm | 4-OCH3 |

|
inactivea | |
| 5bn | 4-NH2 |

|
inactivea | |
| 5bo |

|

|
inactive | |
| 5bp |

|

|
weak inhibitora | |
| 5bq | 2-CH3; 5-NO2 |

|
inactive |
modulatory effect estimated from three concentrations only;
4-parameter logistic model curve could not be fitted.
Hill coefficient could not be calculated with significant accuracy (within 3 units).
