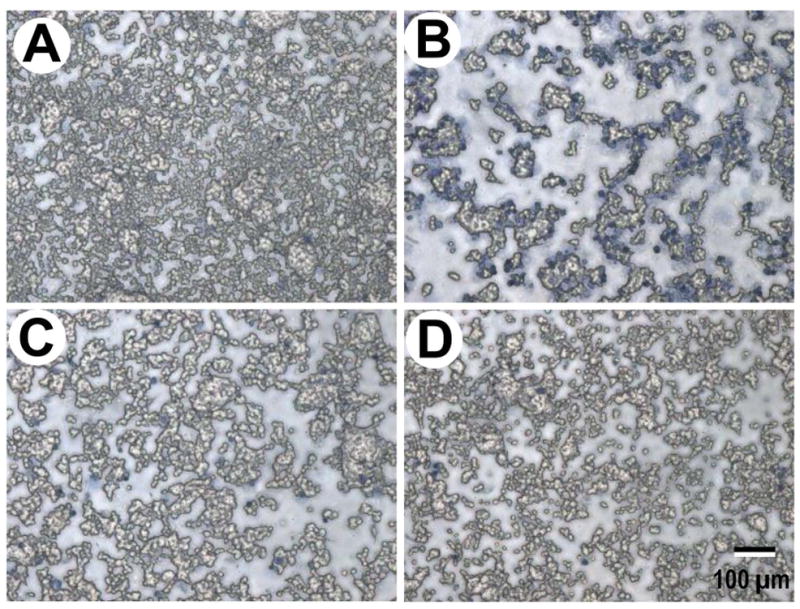
Figure 9.

Photographic images of PC-12 cells and their plasma membrane damage and cell death induced by acrolein (100 μM) and mitigation by dimercaprol (100 μM). A) Control uninjured cells. Note almost all the PC-12 cells excluded the trypan blue dye, indicating health intact membrane. B) Acrolein-treated cells. PC12 cells were exposed to 100 μM acrolein for 24 hrs. Note most of the PC-12 cells were labeled by trypan blue, indicating membrane damage and increase of permeability to trypan blue. C) PC-12 cells were exposed to acrolein, followed by a delayed (15 min) treatment of dimercaprol (100 μM) for a total incubation time of 24 hrs. Notice the significant number of PC-12 cells were protected by dimercaprol and excluded trypan blue. D) PC12 cells were exposed to 100 μM dimercaprol (no acrolein) for 24 hrs. Note few PC-12 cells were labeled by trypan blue, indicating dimercaprol had little cytotoxicity to PC-12 cells. The scale bar represents 100 μm (for A, B, C, and D).
