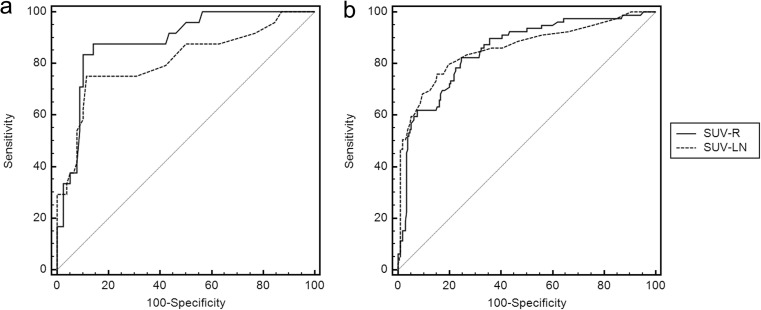
Fig. 2.
ROC curve analysis comparing the diagnostic performance of SUV-R and SUV-LN. a In the low SUV-T group, the AUC of SUV-R was significantly higher than that of SUV-LN (0.885 vs. 0.810, respectively; P = 0.019). b In all nodal stations without grouping, the AUCs of SUV-LN and SUV-R were not significantly different (0.866 vs. 0.848, respectively; P = 0.190)

