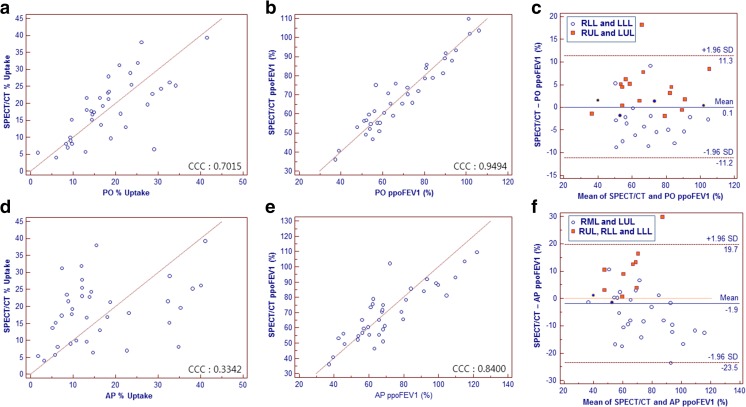
Fig. 4.
Scatter plots with line of equality representing target region concordance between SPECT/CT and (a) PO method % uptake, (b) PO method ppoFEV1%, (d) AP method % uptake, and (e) AP method ppoFEV1%. The Bland-Altman plot showing limits of agreement between SPECT/CT and planar scan derived ppoFEV1%, (c) PO method determined as 0.1 ± 11.2 %, and (f) AP method determined as −1.9 ± 21.6 %. Different lobar distribution is color coded. Blue coded dots are regions with pneumonectomy and regions, for the PO method, with right middle lobectomy

