
Figure 3.
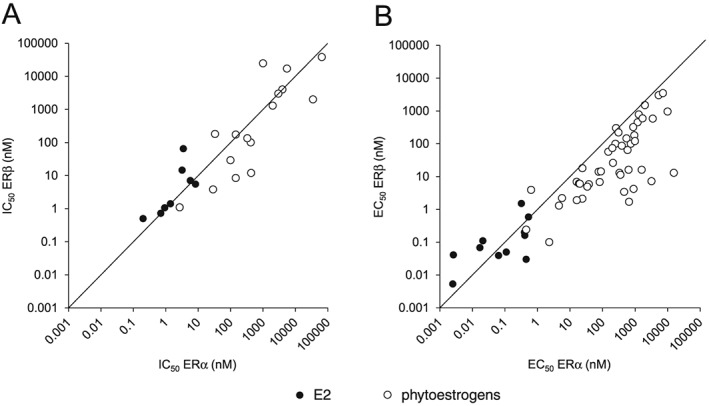
(A) Binding affinities to ERα and ERβ (expressed as IC50 values) and (B) effect concentrations in ERα and ERβ reporter gene assays (expressed as EC50 values) of E2 and phytoestrogens. In Tables S1 and S2, the IC50 and EC50 values, respectively, and the references to the literature are presented.