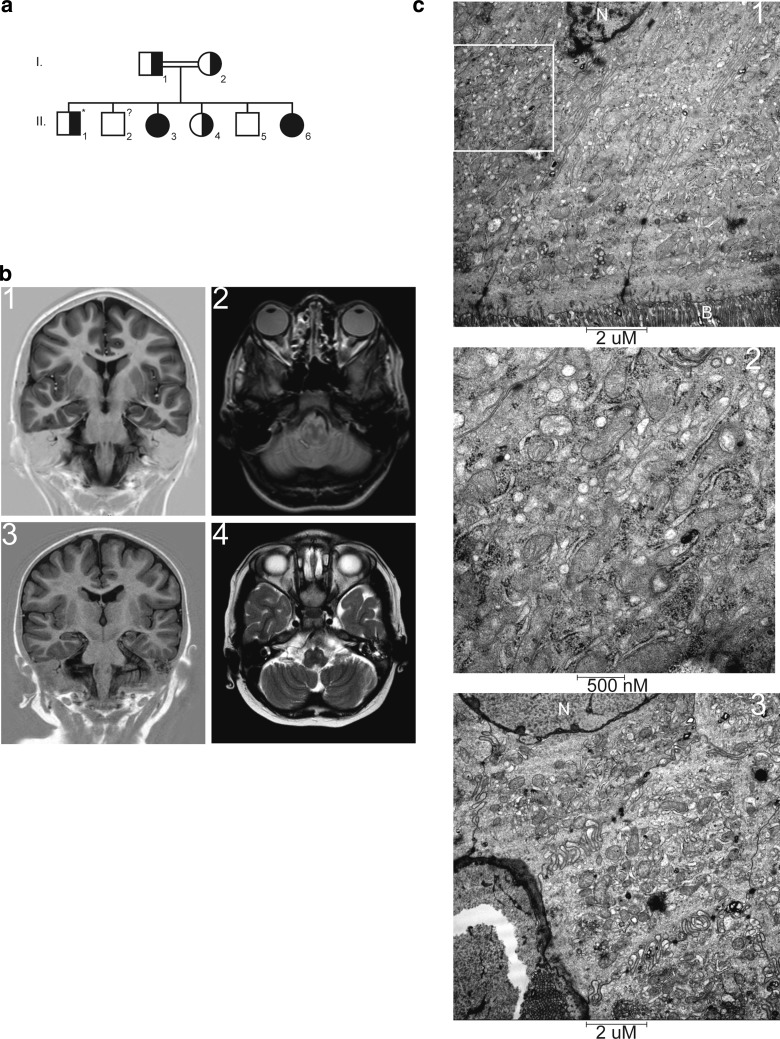
Fig. 1.
Family tree and brain magnetic resonance imaging (MRI) of the affected siblings. a Schematic representation of the family tree. Individual II-2 was lost to follow-up and could, therefore, not be genetically tested. This person is without symptoms. The asterisk marks individual II-1 who has intellectual and motor regression, macrocephaly and adiposity but has no indications of mitochondrial disease and his symptoms are assumed to be unrelated to his PET117 carrier status. Individuals II-3 and II-6 are subjects 1 and 2, respectively. b1 Inversion recovery (IR) MRI, and b2 T2 weighted MRI images are of subject 1. b3 IR MRI image, and b4 T2 MRI image of subject 2. These images show normal myelination, normal gyral pattern, and normal corpus callosum. Hyperintense areas are noted on the T2 image at the site of the medulla oblongata. c Electron microscopic analysis of the ileum of subject 2. Increased numbers of mitochondria were noted on the apical (c1, c2 magnification of the indicated region of c1) and the basal (c3) region of the enterocytes. N nucleus, B brush border

