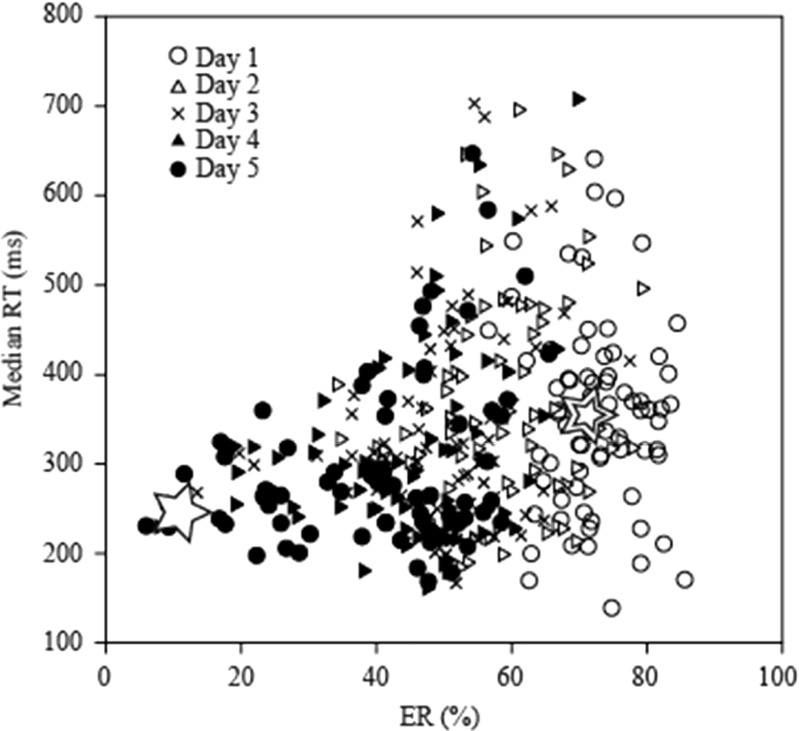
Fig. 6.
Distribution of daily error rates (ERs) and median reaction times (RTs). The distribution of the data five days after reversal in the third and fourth training periods indicate that the relationship between ERs and median RTs differed from day to day. The open star and the double open star indicate the means of the ERs and RTs on Days 0 and 1, respectively

