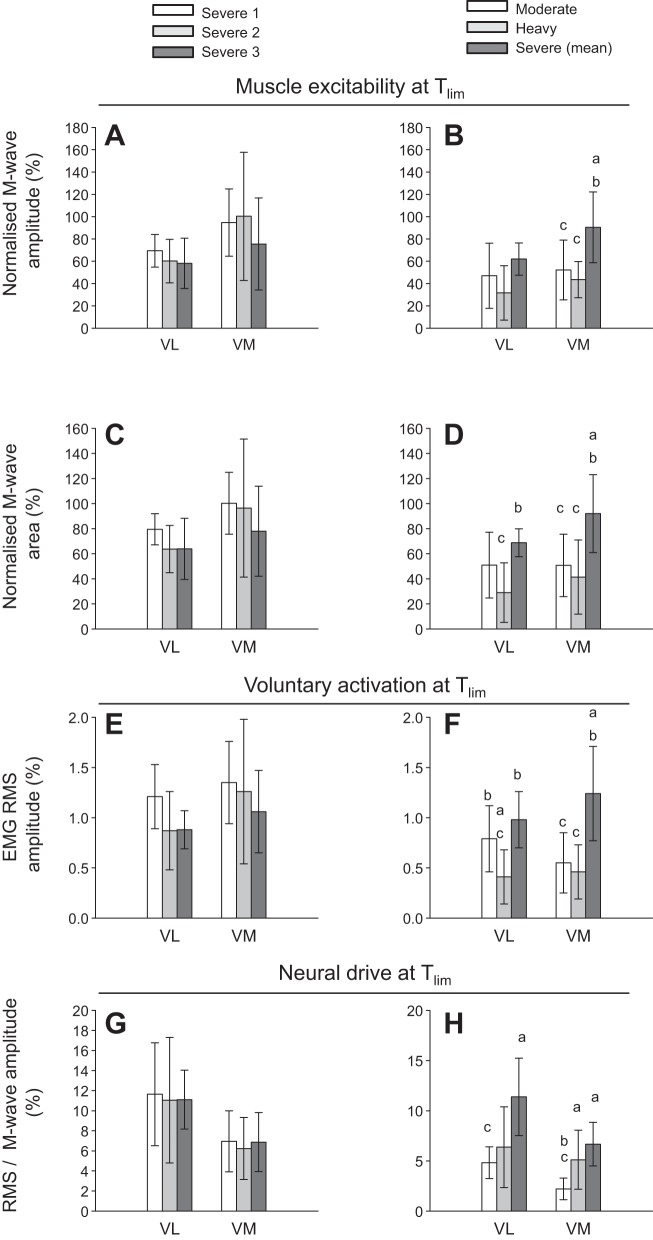
Fig. 5.
Compound muscle action potential (M-wave) amplitude and M-wave area (normalized to maximum M-wave during baseline pedalling) (group means ± SD) indicating peripheral neuromuscular excitability (A–D); voluntary electromyographic root mean square (EMG RMS) amplitude (normalized to M-wave amplitude at 1 min of exercise) indicating muscle activation level (E and F); and RMS/M-wave (normalized to corresponding M-wave amplitude at each measurement time point) indicating central fatigue (G and H) at the limit of tolerance (Tlim) for moderate-, heavy-, and severe-intensity exercise (B, D, F, and H) and for three work rates (severe 1 ~85%Δ, severe 2 ~75%Δ, and severe 3 ~65%Δ) within the severe-intensity domain (A, C, E, and G). There were no significant differences among the severe-intensity work rates in muscle excitability (A and C) or indices of central fatigue (E and G). VL, vastus lateralis muscle; VM, vastus medialis muscle. aDifferent from moderate-intensity P < 0.05; bdifferent from heavy-intensity P < 0.05; cdifferent from severe-intensity P < 0.05.

