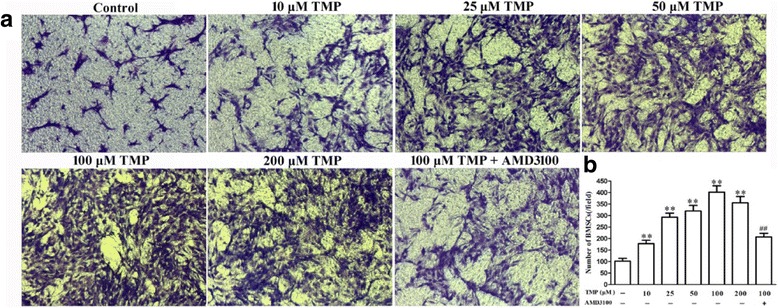
Fig. 2.

TMP enhanced BMSCs migration in vitro. a Representative images of migrated BMSCs in the transwell assay (magnification × 200). b Quantification of transwell results. Values are mean ± SD. **P < 0.01 vs. control. ## P < 0.01 vs. 100 μM TMP. BMSCs bone marrow-derived mesenchymal stem cells, TMP tetramethylpyrazine
