
Fig. 1.
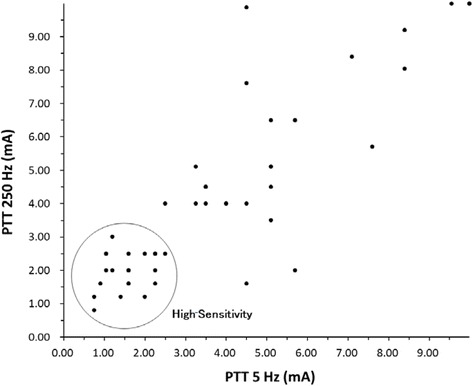
Scatter plot of the PTTs of the participants. Each circle represents one patient. A cluster analysis conducted with Ward’s method indicated that the Others group had higher PTTs than the High-Sensitivity group. PTT, pain tolerance threshold
Official websites use .gov
A
.gov website belongs to an official
government organization in the United States.
Secure .gov websites use HTTPS
A lock (
) or https:// means you've safely
connected to the .gov website. Share sensitive
information only on official, secure websites.
Scatter plot of the PTTs of the participants. Each circle represents one patient. A cluster analysis conducted with Ward’s method indicated that the Others group had higher PTTs than the High-Sensitivity group. PTT, pain tolerance threshold