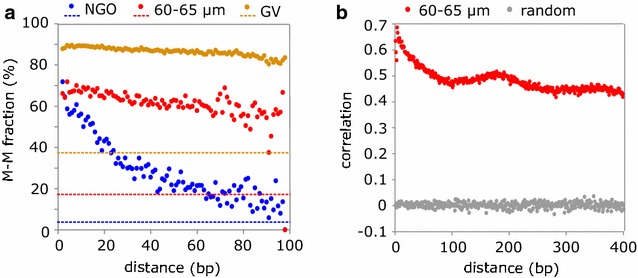
Fig. 2.

Properties of ongoing de novo DNA methylation in growing oocytes. a Average proportion of neighbouring CpG pairs where both CpGs are methylated (M–M fraction) by distance of CpG pairs in NGO, 60–65 µm and GV oocytes. The value of the M–M fraction was quantified for each possible distance between two neighbouring CpGs on the same sequencing read using formula M–M pairs/(M–M + M–U pairs), where M–U pairs represent CpG pairs where upstream CpG is methylated and downstream unmethylated. Only reads mapping to chromosome 1 were analysed. The horizontal lines represent the genomic average methylation level of each stage. b The distant-dependent correlation of methylation between CpG pairs in 60–65 µm oocytes, compared with random-shuffled data
