Fig. 5.

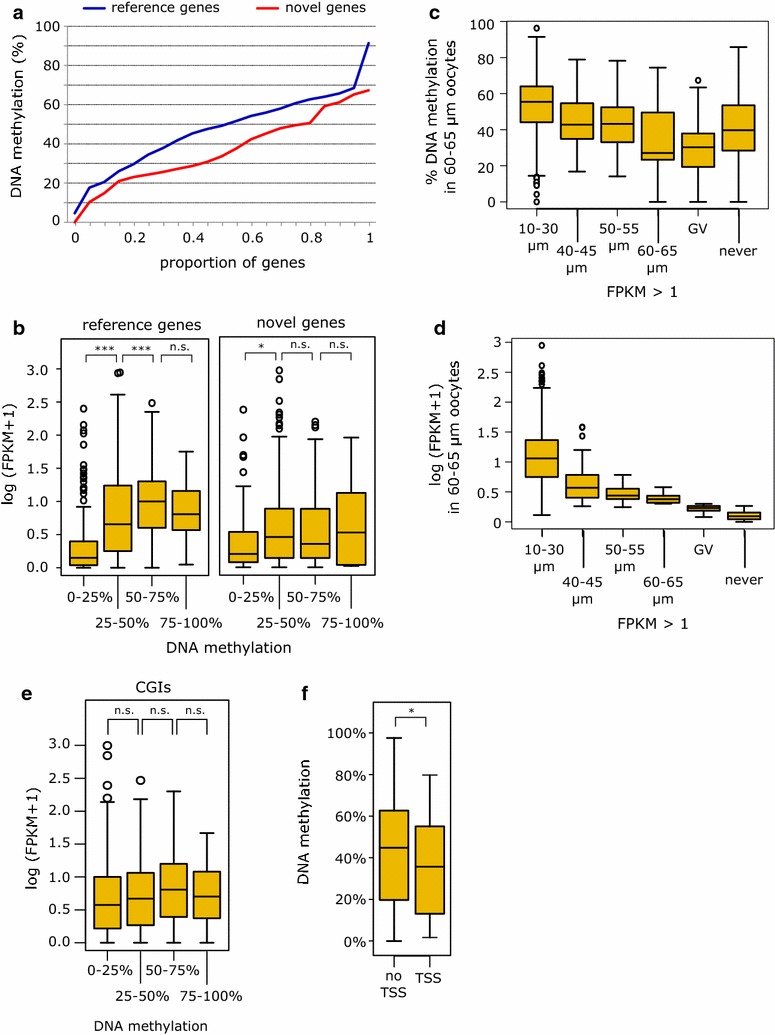
Gene body and CpG island methylation kinetics in relation to transcription. a Cumulative distribution plot of methylation level of reference and novel genes (≥4 kb in length and ≥2 FPKM) in 60–65 µm oocytes (PBAT dataset). The numbers of reference and novel genes satisfying the criteria for analysis were 105 and 32, respectively. b Box whisker plots of methylation of gene bodies of reference (1396) and novel (373) genes in relation to expression level in 60–65 µm oocytes. c Box whisker plot showing methylation level of CGIs in 60–65 µm oocytes grouped according to the stage in oocyte growth that expression of overlapping gene attained the threshold of >1 FPKM in the RNA-seq datasets. d Box whisker plot showing the corresponding data from expression level in 60–65 µm oocytes. The numbers of genes in (c) and (d) are: 1013 for 10–30 µm oocytes, 76 for 40–45 µm, 70 for 50–55 µm, 47 for 60–65 µm, 57 for GV and never 289. e Methylation level of intragenic CGIs (CGIs fully methylated in GV oocytes) in relation to expression level of the corresponding gene in 60–65 µm oocytes. The numbers of CGIs analysed in each methylation category (from lowest to highest) are: 269, 210, 281 and 50. f Methylation in 60–65 µm oocytes of CGIs (CGIs fully methylated in GV oocytes) according to prior activity as TSS as determined in e18.5 oocytes: 112 TSS-CGIs and 1229 non-TSS-CGIs. Asterisks denote p values of Student’s t test: *0.01–0.001, **0.001–0.0001, ***<0.0001
