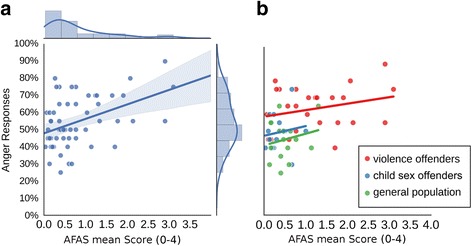
Fig. 6.

Correlations of face perception and aggressions scores. Scatterplots with the mean AFAS score of each participant on the x-axis and percentage of anger responses for the ambiguous 50–50 face on the y-axis; a, plotted for all participants with area around the regression line indicating the 95% confidence interval; b, for each group separately, with line length reflecting the range of each sample's data
