Fig. 2.

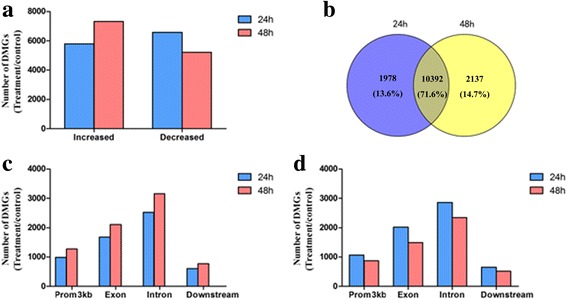
Number and distribution of DMGs in the 24- and 48-h groups. a The total number of significantly increased and decreased genes based on changes in methylation. b Composition of DMGs in the two treatment groups. c Distribution of hypermethylated genes in different genomic regions. d Distribution of hypomethylated genes in different genomic regions
