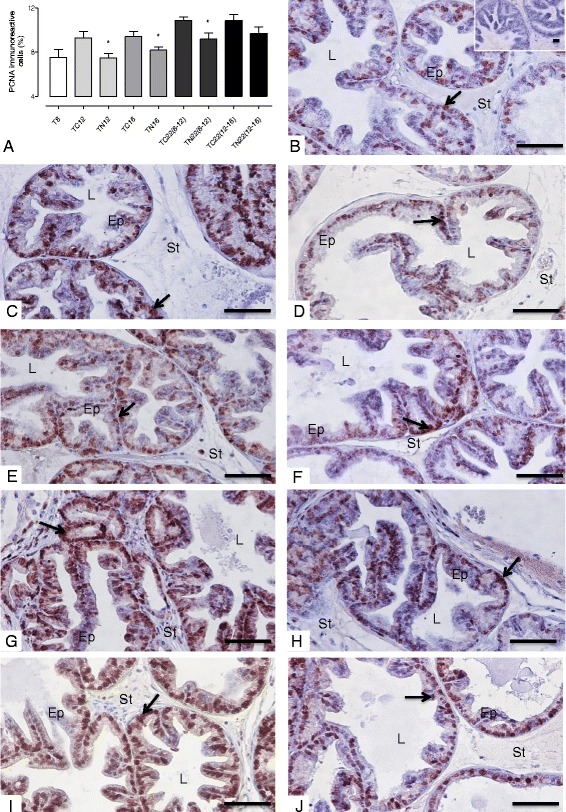
Fig. 3.

PCNA immunoreactivity. a Quantification of PCNA immunoreactivity. b T8 group (inset: negative control). c: TC12 group. d TN12 group. e TC16 group. f TN16 group. g TC22(8–12) group. h TN22(8–12) group. i TC22(12–16) group. j TN22(12–16) group. PCNA-positive staining is indicated by arrow in the nucleus. Values expressed as media or maximum media values and compared between treated and its respective control group. *p < 0.05. Ep = epithelium; St = stroma; L = lumen. Counter-stain: Harris Hematoxylin. 400x, bar = 100 μm
