
Fig. 7.
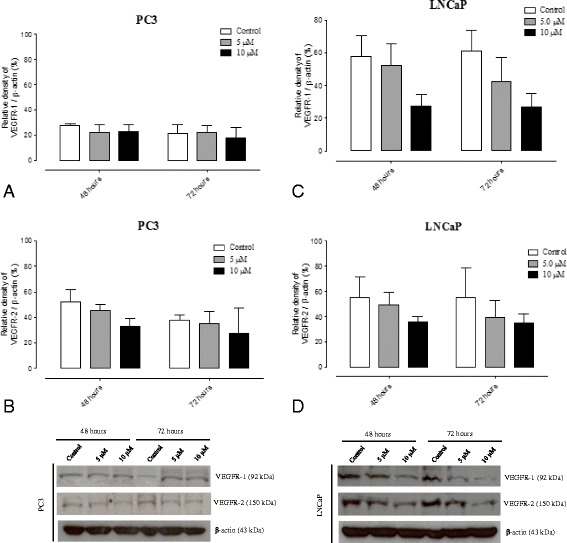
Protein level quantification on PCa cell lines treated with different Nintedanib concentrations. a VEGFR-1 quantification in PC3 cells (n = 3). b VEGFR-2 quantification in PC3 cells (n = 3). c VEGFR-1 quantification in LNCaP cells (n = 3). d VEGFR-2 quantification in LNCaP cells (n = 3). Values related to β-actin (endogenous control), compared between treated and its respective control group and expressed as media ± S.E.M