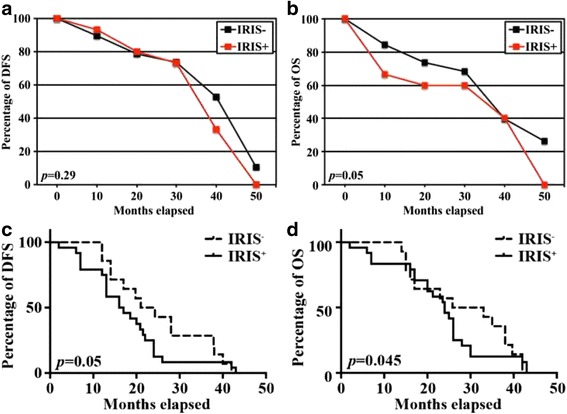
Fig. 1.

The effect of BRCA1-IRIS overexpression on DFS and OS in non-TNBC and TNBC patients. (a) No significant differences in DFS between BRCA1-IRIS-overexpressing and -negative tumors in the non-TNBC group (p = 0.29). (b) Statistically significant difference in OS between BRCA1-IRIS-overexpressing and -negative tumors in the non-TNBC group (p = 0.05, b). Significantly lower DFS (p = 0.05, c) and OS (p = 0.045, d) in BRCA1-IRIS-overexpressing tumors compared to BRCA1-IRIS-negative tumors in the TNBC group
