
Fig. 1.
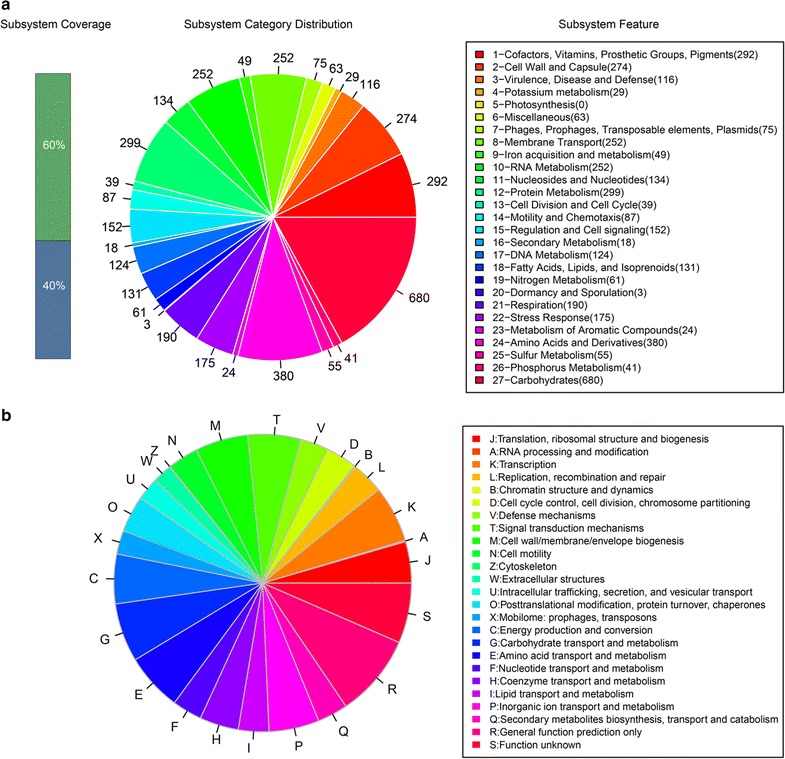
Analysis of annotated genes in S. flexneri strain SP1 based on the SEED and COG databases. a The green bar represents the percentage of proteins that were annotated by RAST server, while the blue bar indicated the proteins not annotated. The pie chart demonstrates the abundance of each subsystem category and the count of each subsystem feature is shown. b Distribution of COGs. Each bar indicates the number of annotated genes based on the COG database