
Fig. 2.
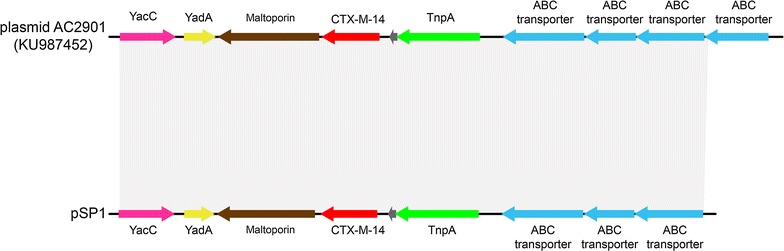
Genetic organization of scaffolds (portions of genome sequences reconstructed from the whole-genome sequence) containing bla CTX-M-14 harbored by plasmid pSP1 and structural comparison with plasmid pAC2901. Arrows indicate positions and direction of transcription of genes. Regions with >99% homology are shown in gray. Information in parentheses after isolates represents the GenBank accession number