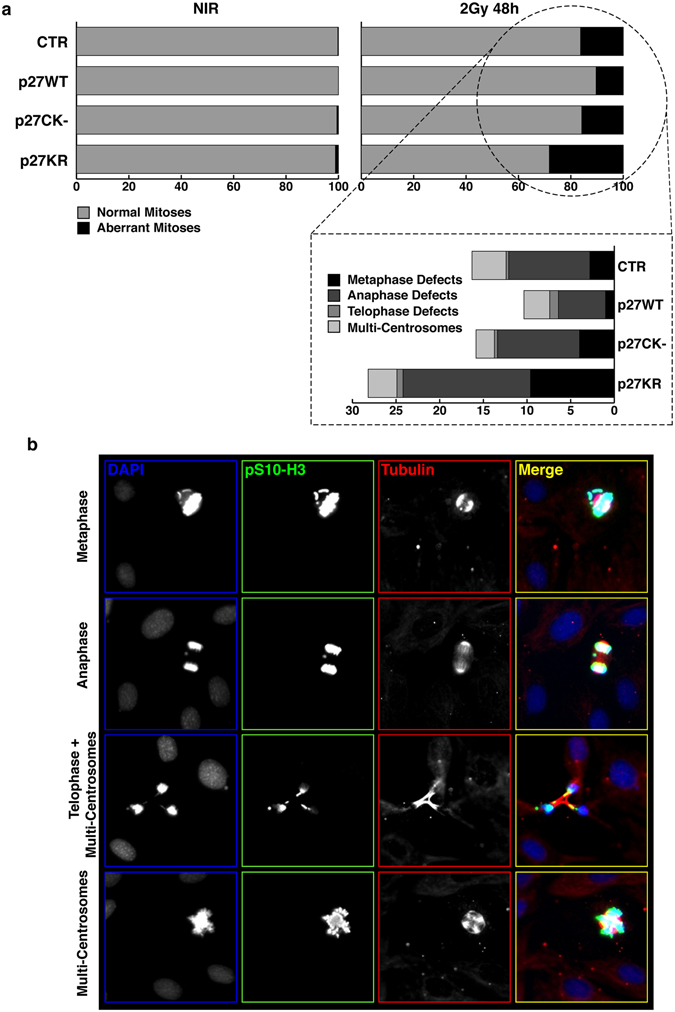
Figure 3.

IR of p27KO cells is associated to mitotic aberrations. (a) Graph reports the quantification of aberrant mitoses encountered in the different cell clones when non-irradiated (NIR, left panels) or irradiated with 2 Gy (right panels) at 48 hours after radiation. Data are expressed as % of total cells. At the bottom, the aberrations were sub-classified respect to mitotic phases. (b) Representative pictures of cells reporting the above mentioned mitotic aberrations. Cells were stained for phospho-Ser10 Histon-H3 (pS10-H3) to identify mitotic cells (pseudocolored in green, shown in white), αTubulin to highlight the mitotic spindle (pseudocolored in red, shown in white) and DAPI to identify the cell nuclei (pseudocolored in blue, shown in white). Only the merged picture is shown with colors.
