Figure 6.

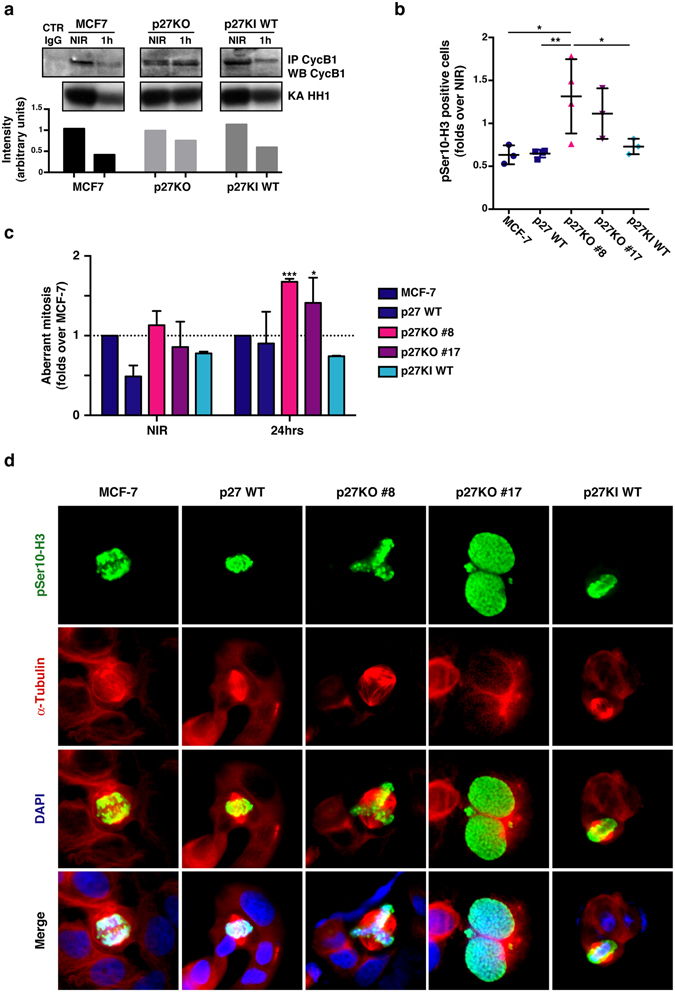
Luminal breast cancer cells KO for p27 are radio-resistant and accumulate mitotic defects. (a) Blots report the kinase assay (KA) on Histon H1 (HH1) by cyclin B1-associated CDK activity (lower panels). Upper panels show the level of immunoprecipitated cyclin B1 in the indicated cell clones. Bottom graph reports the quantification of HH1 phosphorylation, normalized for the quantity of immunoprecipitated cyclin B1. Full-length blot is shown in Supplementary Fig. S3. (b) Graph reports the quantification of pS3-H3 positive cells 2 hours after 2 Gy, evaluated by counting IF labeled cells, in indicated MCF-7 clones. Data are expressed as fold increase over NIR cells. (c) Graph reports the quantification of aberrant mitoses displayed by MCF-7 clones, in NIR or 24 hours after 2 Gy. Data are expressed as fold increase over the aberrant mitoses found in MCF-7 parental cells. (d) Representative pictures of cells reporting the above mentioned mitotic aberrations. Cells were stained for phospho-Ser10 Histon-H3 (pS10-H3) to identify mitotic cells (pseudocolored in green), αTubulin (pseudocolored in red) to highlight the mitotic spindle and DAPI (pseudocolored in blue) to identify the cell nuclei. *Indicates a p < 0.05; **p < 0.01.
