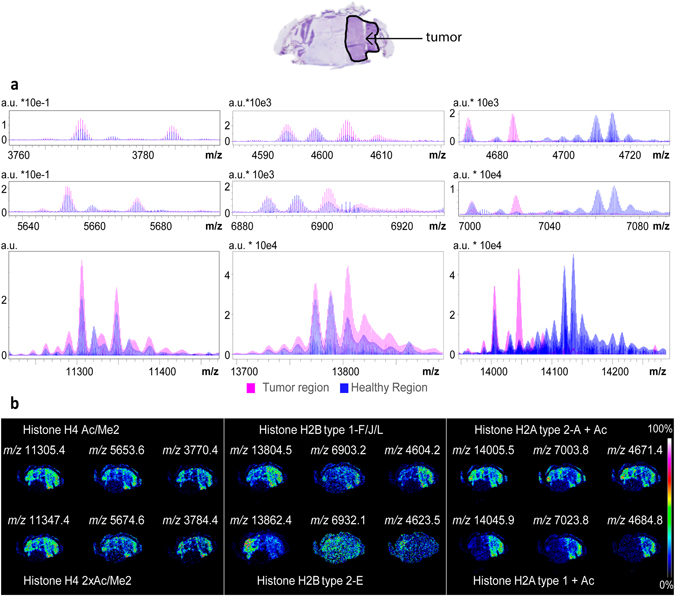
Figure 3.

Differential regulation of histone proteoforms. (a) Overlay of the average mass spectra extracted for the tumor ROI (pink) and the healthy ROI (blue), showing the mass ranges of the triply (top), doubly (middle), singly (bottom) charged ions of Histone H4 (left), Histone H2B (middle), Histone H2A (right). (b) MS images for some of the detected proteoforms; protein assignments were made via alignment with the LC-MS/MS results for microdissected samples of tumor and healthy regions of tissue.
