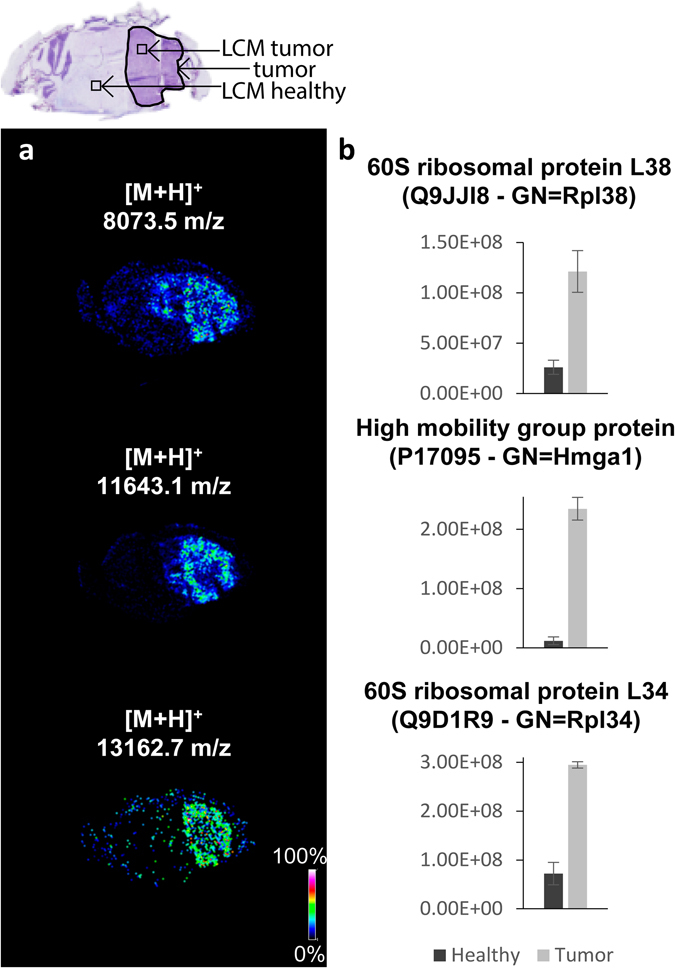
Figure 4.

Comparison of LC-MS/MS and MALDI MSI data: the agreement between the fold-changes determined by LC-MS/MS of microdissected regions (microdissected regions are indicated in top histological image) and MSI datasets is demonstrated for three protein ions. In each case the LC-MS/MS relative quantification confirmed that observed with MALDI MSI. (a) Images extracted from the MSI dataset for 60 S ribosomal protein L38, High mobility group protein, 60 S ribosomal protein L34 (from the top). (b) LC-MS/MS relative quantification: the bar charts report the sum of the areas of each protein’s tryptic peptides (data are mean area ± standard deviation).
