Figure 2.

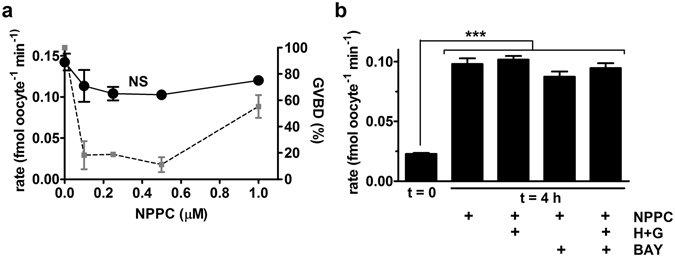
Effect of NPPC on GLYT1 activation. (a) GLYT1 activity (black circles) was measured as the rate of transport of [3H]-glycine by oocytes isolated from COCs that had been cultured for 4 h as a function of NPPC concentration (0–1 µM) during culture. Increasing NPPC concentration had no significant effect on GLYT1 activity (NS, by ANOVA, P = 0.16). The extent of GVBD in the oocytes used for GLYT1 activity measurements here was previously reported21, and are replotted here (gray squares) for reference. Each point represents the mean ± s.e.m. of 3 or 4 independent repeats. (b) Various inhibitors were tested for an effect on the development of GLYT1 activity in oocytes within COCs cultured for 4 h in the presence of NPPC (100 nM) and E2 (100 nM). As shown in (A), culture with NPPC alone had no significant effect, nor did culture with NPPC and either hypoxanthine (4 mM) and guanosine (50 µM) together (H + G), the PDE9 inhibitor BAY 73-6691(BAY), or all three together. Data were analysed by ANOVA with Tukey test (overall effect: P < 0.0001; between treatments: ***P < 0.001). Each bar represents the mean ± s.e.m. of five independent repeats, except at t = 0 (3 repeats).
