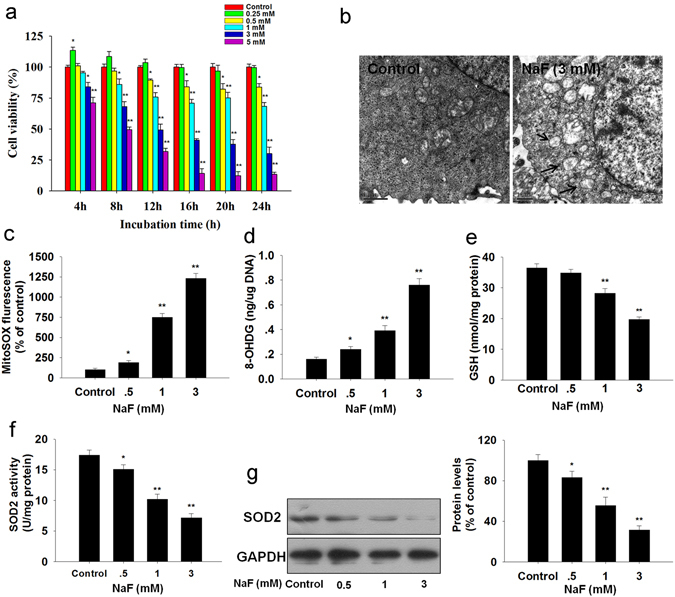
Figure 1.

NaF-induced oxidative stress in TCMK-1 cells. (a) Cells were incubated with the indicated doses of NaF for the indicated period, and then cell viability was determined using the CCK-8 assay. Cells were incubated with fresh medium in the presence or absence of NaF (3 mM) for 12 h, (b) Ultrastructure of TCMK-1 cell. (c) The mitochondrial O2 •− levels. (d) 8-OHdG content (a marker of oxidative DNA damage). (e) Reduced GSH content. (f) SOD2 activity. (g) The representative immunoblot and quantification analysis of SOD2. All results are representative of three independent experiments and values are presented as means ± s.d. *p < 0.05, **p < 0.01 versus the control group. Full-length blots/gels are presented in Supplementary Figure S8.
