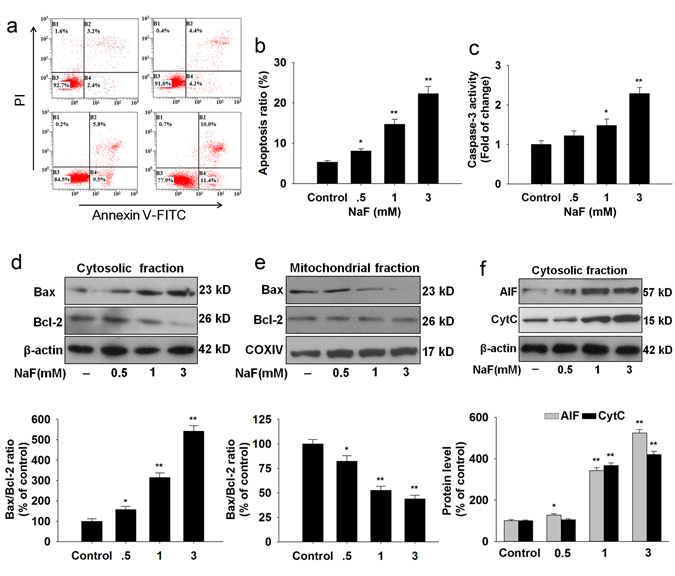
Figure 2.

NaF-induced apoptosis in TCMK-1 cells. Cells were incubated with the indicated doses of NaF for 12 h. (a) Representative images of flow cytometry by Annexin V-FITC/PI dual staining. (b) Apoptotic cells are represented as the percentage of Annexin-V single positive plus Annexin-V/PI double-positive cells. (c) Caspase-3 activity was measured using a caspase-3 fluorescent assay kit. Cells were harvested and lysed to detect the cytoplasmic (d) and mitochondrial (e) levels of Bax and Bcl-2. (f) The levels of AIF and CytC in the cytosolic fraction were detected in TCMK-1 cells. All results are representative of three independent experiments and values are presented as means ± s.d. *p < 0.05, **p < 0.01 versus the control group. Full-length blots/gels are presented in Supplementary Figures S9–11.
