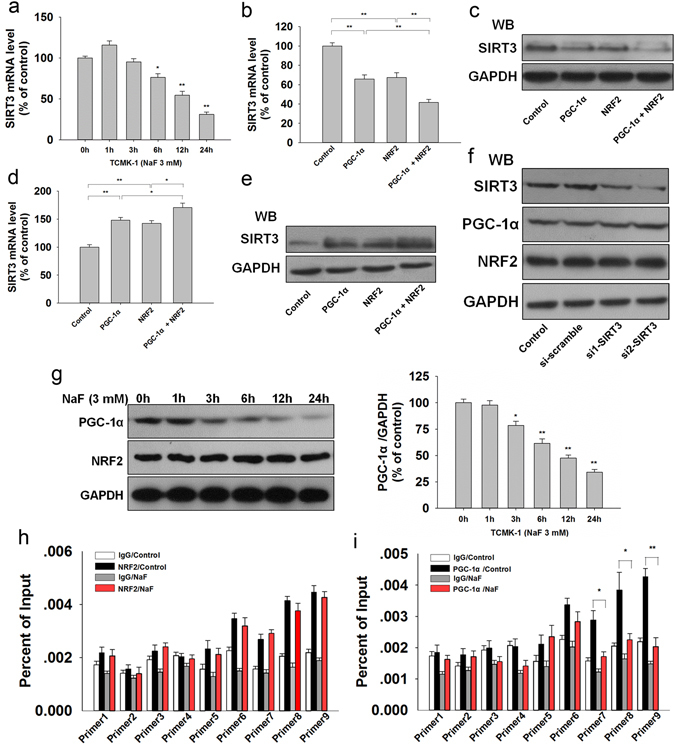
Figure 8.

PGC-1α interacts with NRF2 to mediates SIRT3 expression. (a) SIRT3 mRNA level was measured by qPCR in TCMK-1 cells treated with 3 mM for different times. Data are presented as means ± s.d. of at least three independent experiments. *p < 0.05, **p < 0.01 versus 0 h. The mRNA and protein expression of SIRT3 were measured with PGC-1α and NRF2 knockdown (b,c) or overexpression (d,e), respectively. Data are presented as means ± SD of at least three independent experiments. *p < 0.05, **p < 0.01. (f) SIRT3 was knocked down by SIRT3 siRNA transfection, and then the expression of PGC-1α and NRF2 were determined by western blot. (g) The expression of PGC-1α and NRF2 were determined in TCMK-1 cells treated with 3 mM for different times. *p < 0.05, **p < 0.01 versus 0 h. ChIP-qPCR was performed with NRF2 (h) and PGC-1α (i) antibodies in TCMK-1 cells under excessive NaF exposure. Data are presented as means ± s.d. of at least three independent experiments. *p < 0.05, **p < 0.01. Full-length blots/gels are presented in Supplementary Figures S18–20.
