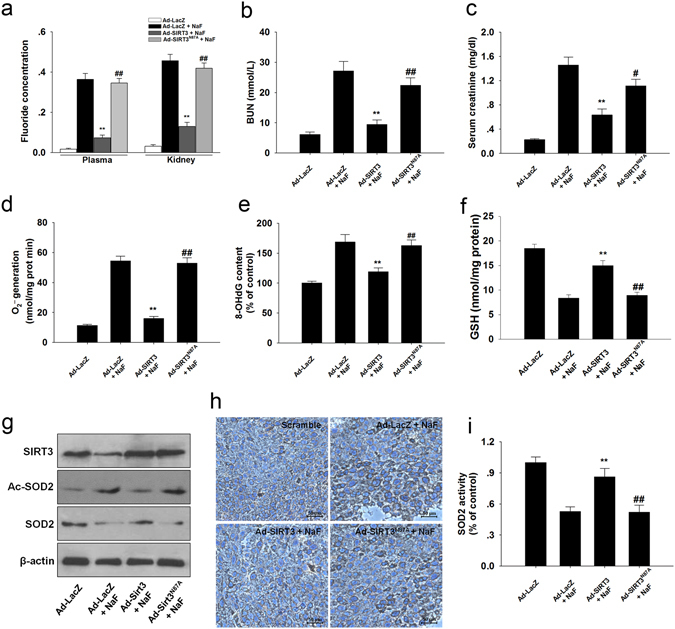
Figure 9.

SIRT3 decreased NaF-induced oxidative stress in mice kidney. (a) The F concentrations in the serum and renal tissues were measured. Plasma, μg/ml; Kidney, μg /g of dry tissue. (b) BUN level. (c) Serum creatinine level. (d) Mitochondrial O2 •− level. (e) 8-OHdG content. (f) Reduced GSH content. (g) Representative western blots for SIRT3, Ac-SOD2, and SOD2 in mice kidney. (h) Immunohistochemical analysis of SOD2 (acetyl K68) expression in kidney tissue. (i) SOD2 activity was determined. Data are mean ± s.d.; n = 6–8. **p < 0.01 versus the Ad-LacZ + NaF group, #p < 0.05, ##p < 0.01 versus the Ad-SIRT3 + NaF group. Full-length blots/gels are presented in Supplementary Figure S21.
