
Figure 1.
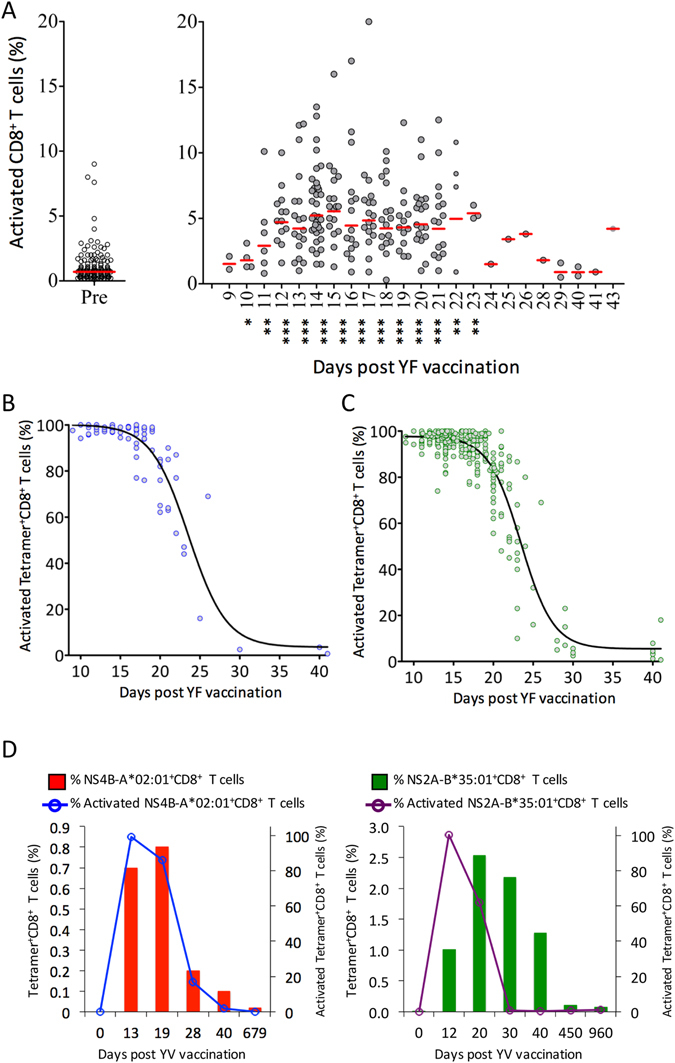
Activation of CD8+ T cells after primary YF-17D vaccination. PBMCs were analysed by flow cytometry. Activated CD8+ T cells were defined as CD38+ HLA-DR+ CD8+ CD3+ T cells (see supplementary Figure S1, left-hand panel). (A) Frequencies of activated CD8+ T cells before and after YFV vaccination. Pre- (day 0) and post-vaccination (day 9 to 43) PBMCs from 209 primary YFV vaccinated donors were analysed. In the left-hand panel, pre-vaccination frequencies are plotted; in the right-hand panel, the post-vaccination frequencies are plotted according to the day the blood sample was collected. The median for each collection day is indicated. Mann Whitney U test was used to determine the significance of the difference between day 0 pre-vaccination, and the indicated day post vaccination (***p < 0.001; **p < 0.01; *p < 0.05). (B) The frequencies of activated and NS4B214-222/HLA-A*02:01 tetramer specific CD8+ T cells from 93 HLA-A*02:01 donors were analysed and plotted according to the day the blood samples were collected. (C) The previous analysis was extended to 11 different HLA- class I tetramer-specific CD8+ T cells from 41 primary vaccinated donors yielding 321 measurements of frequencies of activated and HLA class I tetramer positive CD8+ T cells, which are plotted according to the day the blood sample was collected. (D) PBMCs from two primary vaccinated donors were collected at various time points before and after primary YFV vaccination. In the left-hand panel, the frequencies of activated and NS4B214-222/HLA-A*02:01 tetramer positive CD8+ T cells from donor YF4967 are plotted according to the day the blood samples were collected. In the right-hand panel, the frequencies of activated and NS2A4-13/HLA-B*35:01tetramer positive CD8+ T cells from donor YF7512 are plotted according to the day the blood samples were collected. The frequencies of tetramer+ CD8+ T cells are depicted as histograms with values given on the left Y-axis; whereas the frequencies of activated tetramer positive CD8+ T cells are depicted as a line plot with values given on the right Y-axis.