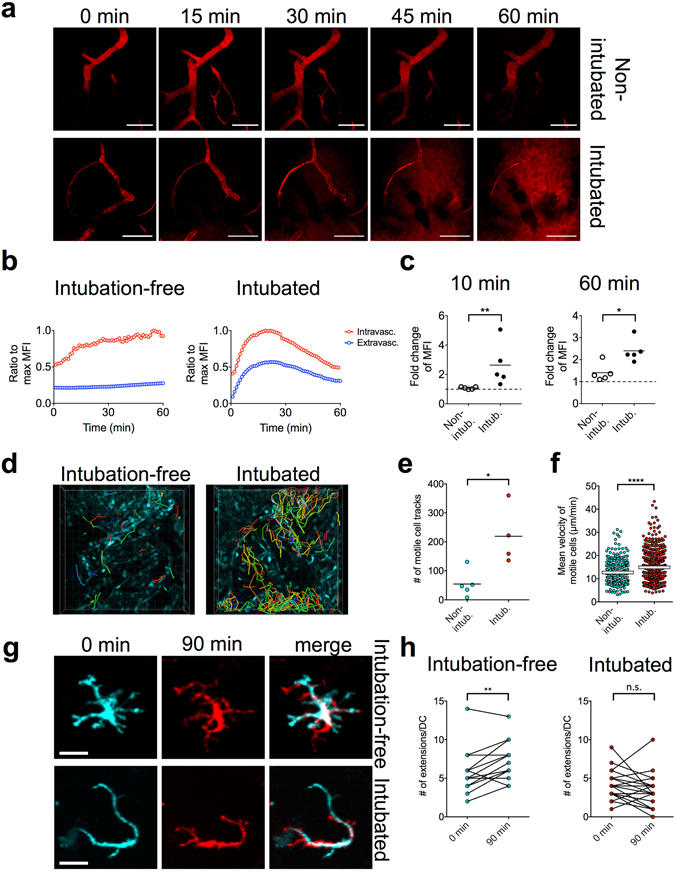
Figure 2.

Comparison between the intubated and intubation-free setup. (a–c) Analysis of vascular leakage by i.v. injected fluorescent dextran, 155 kDa for (a); 2,000 kDa for (b and c). (a) Snapshots from Supplementary Videos 1 and 3 are shown, bar = 100 µm. (b) Changes of MFI in the intravascular vs. extravascular compartment during a 60 min imaging period. Curves are representative of 5 measurements performed with each setup. (c) Analysis of changes in MFI in the extravascular compartment at 10 min or 60 min after dextran injection. MFI of the extravascular space at 1 min was used as a reference (dashed line represents value of 1 = no change; *p < 0.05; **p < 0.01 as determined using Mann-Whitney test, n = 5 mice). (d–f) Analysis of inflammatory cell recruitment to the interstitial space using ubiquitously fluorescent CAG-ECFP mice. (d) Snapshots from Supplementary Videos 1 and 3, colored lines indicate tracks of motile cells, grid spacing = 20 µm. (e) Number of motile cell tracks within a defined volume of tissue (346 µm × 346 µm × 33 µm), detected during a period of 60 min. Cells with a minimum speed of >2 µm/min were considered as motile (*p < 0.05; as determined using Mann-Whitney test, n = 4–5 mice). (f) Analysis of mean velocities; each dot represents one cell. Data were pooled from the analysis of n = 4–5 mice (****p < 0.0001 as determined using Mann-Whitney test). (g,h) Analysis of IE-DC dynamic probing behavior. (g) Snapshots of individual IE-DCs at the beginning and at the end of a 90 min imaging period (with overlay, see also the corresponding Supplementary Videos 6 and 7), bar = 20 µm. (h) Number of dendritic extensions/IE-DC; each dot represents an IE-DC. The same cell was analyzed at the beginning and at the end of a 90 min imaging period (**p < 0.01 and n.s.: non-significant, as determined using paired t-test).
