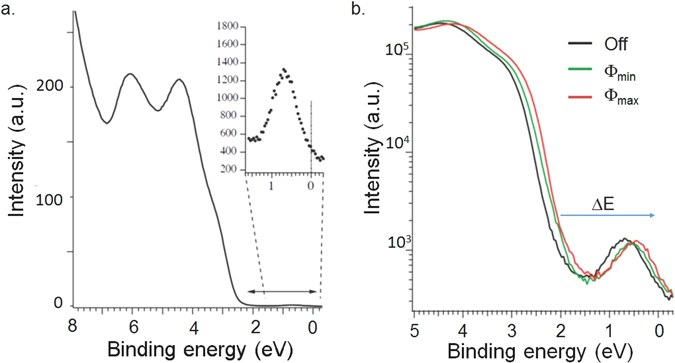
Figure 3.

(a) Photoemission intensity as a function of binding energy obtained on in-situ cleaved CH3NH3PbBr3 single crystal surface. Beyond the LUMO levels at high binding energies, one can read clearly the 2.2 eV band gap and a well-defined excitation close to the Fermi level; (b) The semi-log plot reproduces figure a (black line) and to spectra measured under 1.5 mW (green line) and 4.5 mW (red line) white light illuminations. The density of states at the Fermi level increases with the light intensity.
