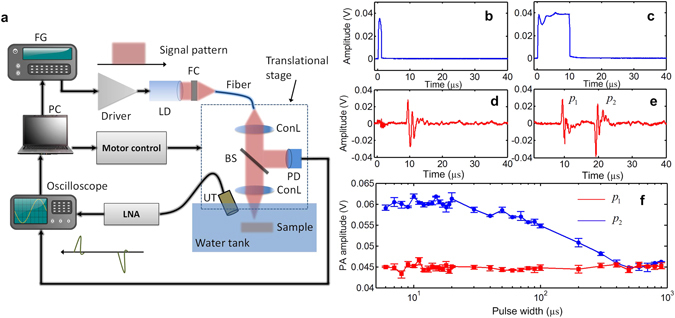
Figure 3.

(a) The schematic of the experimental setup. FC: function generator; LD: laser diode; FC: fiber coupler; ConL: condenser lens; BS: beam splitter; PD: Photodiode UT: ultrasound transducer; LNA: low-noise amplifier. (b,c) The light illumination signal detected by the photodiode with pulse width of 1 µs and 10 µs. (d,e) The measured LDPA signals with 1 µs and 10 µs pulse width laser illumination. (f) Amplitudes of first PA signal (red line, square symbol) and second PA signal (blue line, circle symbol) by sweeping the pulse width of the laser source.
