Figure 2.

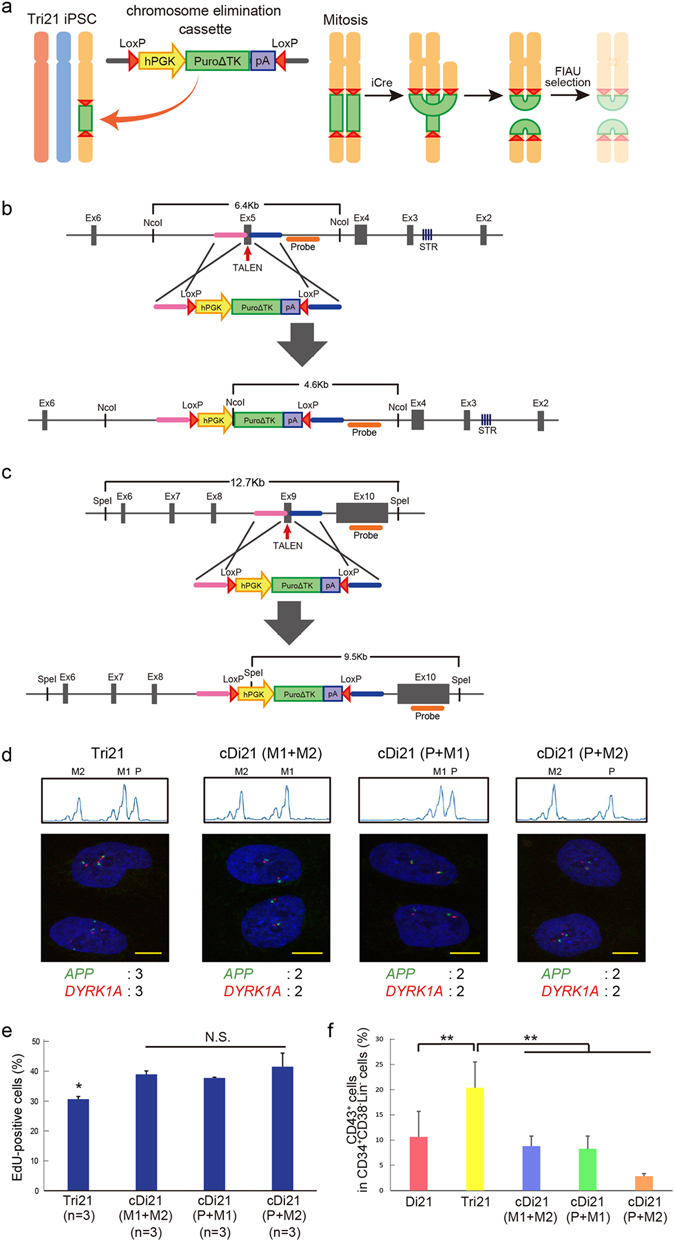
Establishment of corrected Di21 iPSCs. (a) Method for establishing corrected Di21 (cDi21) iPSCs using chromosome elimination technology. Chromosome elimination cassette was introduced into one of three copies of chromosome 21 in Tri21 iPSCs by TALENs. Cre–loxP-mediated recombination between sister chromatids in mitosis caused dicentric chromosomes and those without centromeres. Daughter cells without these aberrant chromosomes were obtained using FIAU selection. (b,c) Targeting strategy for introducing chromosome elimination cassette into (b) RUNX1 and (c) ETS2 loci on chromosome 21. Enlarged illustrations indicate each gene locus, including exons (grey boxes), TALEN target sites (red arrows), microsatellite sequences (purple stripe), homology arms (pink and blue bars) and probes for Southern blot analysis (orange bars). Below are illustrations of each donor plasmid including homology arms, human PGK promoters, drug-resistance genes (PuroΔTK), poly(A) sequences and loxP sequences (red triangles). PuroΔTK, fusion protein of puromycin and a truncated version of herpes simplex virus type 1 thymidine kinase. In targeting RUNX1 and ETS2 genes, STR and SNP analyses were used, respectively, to identify the parental origin of chromosome 21. (d) Top: Short tandem repeat (STR) analysis in each human iPSC (hiPSC) line. STR analysis of the patient with DS and his parents was performed to identify each allele of the RUNX1 gene in Tri21 iPSCs. STR sequences of RUNX1 were compared between Tri21- and each cDi21-iPSCs. Bottom: DNA FISH of chromosome 21-specific probes. APP gene was labelled with DyLight488 (green) and DYRK1A gene was labelled with DyLight594 (red) probe. Nuclei were stained with DAPI. Expected numbers of APP and DYRK1A foci in each iPSC line are shown below. cDi21(M1 + M2) and cDi21(P + M1) were established through RUNX1 targeting, while cDi21(P + M2) was established through ETS2 targeting. Scale bars represent 10 μm. (e) EdU cell proliferation assay in each hiPSC line. Graph shows the proportion of EdU-positive cells. (f) Haematopoietic differentiation of each cell line. Graph shows the proportion of CD43-positive cells in CD34+CD38−Lin− cells derived from day 8 embryoid bodies (n = 3). Error bars represent SEM. p values were determined by Student’s t-test. *p < 0.05, **p < 0.01.
